Estimated Value: $324,295 - $375,000
3
Beds
1
Bath
1,062
Sq Ft
$324/Sq Ft
Est. Value
About This Home
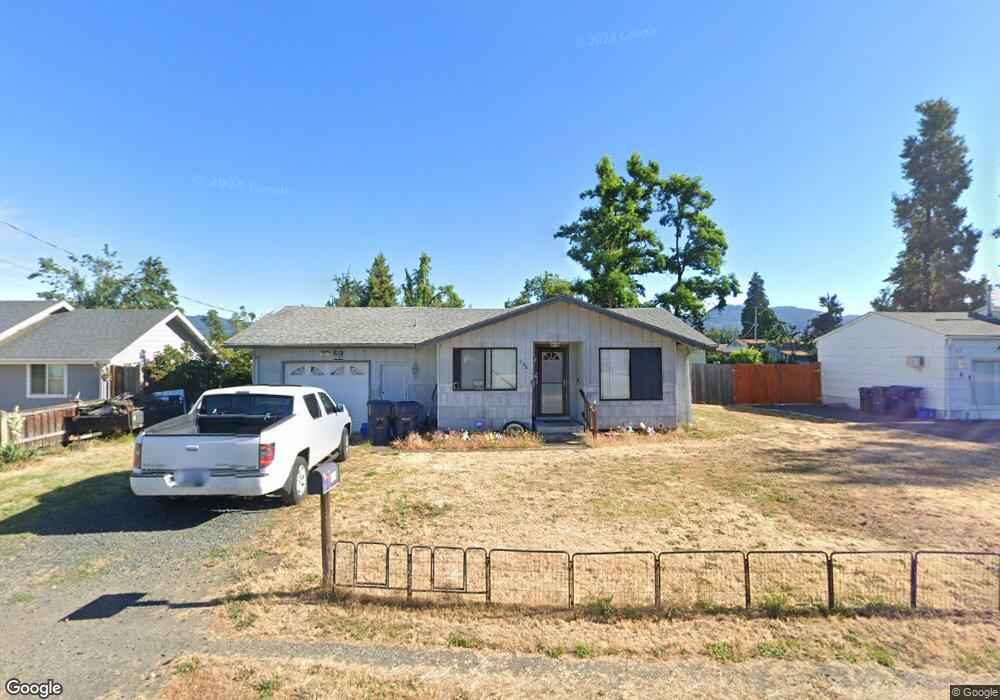
This home is located at 5146 D St, Springfield, OR 97478 and is currently estimated at $343,824, approximately $323 per square foot. 5146 D St is a home located in Lane County with nearby schools including Riverbend Elementary School, Agnes Stewart Middle School, and Thurston High School.
Ownership History
Date
Name
Owned For
Owner Type
Purchase Details
Closed on
Jan 11, 2013
Sold by
Blunck Beverly Carol
Bought by
Akins James Thomas
Current Estimated Value
Home Financials for this Owner
Home Financials are based on the most recent Mortgage that was taken out on this home.
Original Mortgage
$88,500
Outstanding Balance
$61,027
Interest Rate
3.27%
Mortgage Type
New Conventional
Estimated Equity
$282,797
Purchase Details
Closed on
Jan 9, 2013
Sold by
Modisette Edwin M
Bought by
Blunck Beverly Carol and Akins James Thomas
Home Financials for this Owner
Home Financials are based on the most recent Mortgage that was taken out on this home.
Original Mortgage
$88,500
Outstanding Balance
$61,027
Interest Rate
3.27%
Mortgage Type
New Conventional
Estimated Equity
$282,797
Purchase Details
Closed on
Oct 8, 2010
Sold by
Modisette Edwin M and Modisette Cleo I
Bought by
Blunck Beverly Carol and Akins James Thomas
Create a Home Valuation Report for This Property
The Home Valuation Report is an in-depth analysis detailing your home's value as well as a comparison with similar homes in the area
Home Values in the Area
Average Home Value in this Area
Purchase History
| Date | Buyer | Sale Price | Title Company |
|---|---|---|---|
| Akins James Thomas | -- | Multiple | |
| Blunck Beverly Carol | -- | Multiple | |
| Blunck Beverly Carol | -- | None Available |
Source: Public Records
Mortgage History
| Date | Status | Borrower | Loan Amount |
|---|---|---|---|
| Open | Akins James Thomas | $88,500 |
Source: Public Records
Tax History
| Year | Tax Paid | Tax Assessment Tax Assessment Total Assessment is a certain percentage of the fair market value that is determined by local assessors to be the total taxable value of land and additions on the property. | Land | Improvement |
|---|---|---|---|---|
| 2025 | $2,593 | $141,407 | -- | -- |
| 2024 | $2,551 | $137,289 | -- | -- |
| 2023 | $2,551 | $133,291 | $0 | $0 |
| 2022 | $2,363 | $129,409 | $0 | $0 |
| 2021 | $2,320 | $125,640 | $0 | $0 |
| 2020 | $2,253 | $121,981 | $0 | $0 |
| 2019 | $2,185 | $118,429 | $0 | $0 |
| 2018 | $2,060 | $111,631 | $0 | $0 |
| 2017 | $1,980 | $111,631 | $0 | $0 |
| 2016 | $1,939 | $108,380 | $0 | $0 |
| 2015 | $1,884 | $105,223 | $0 | $0 |
| 2014 | $1,855 | $102,158 | $0 | $0 |
Source: Public Records
Map
Nearby Homes
- 5089 D St
- 567 53rd Place
- 340 54th St
- 733 54th St
- 0 N St
- 5495 A Units 69 70 71 72 St
- 5570 B St
- 5524 E St
- 205 S 54th (#11) St Unit 11
- 422 S 49th Place
- 205 S 54th St
- 503 S 51st Place
- 5335 Main St Unit 236
- 5335 Main St Unit 212
- 5335 Main St Unit 184
- 5335 Main St Unit 197
- 5335 Main St Unit 7
- 5335 Main St Unit 154
- 5335 Main St Unit 187
- 569 S 51st Place
Your Personal Tour Guide
Ask me questions while you tour the home.