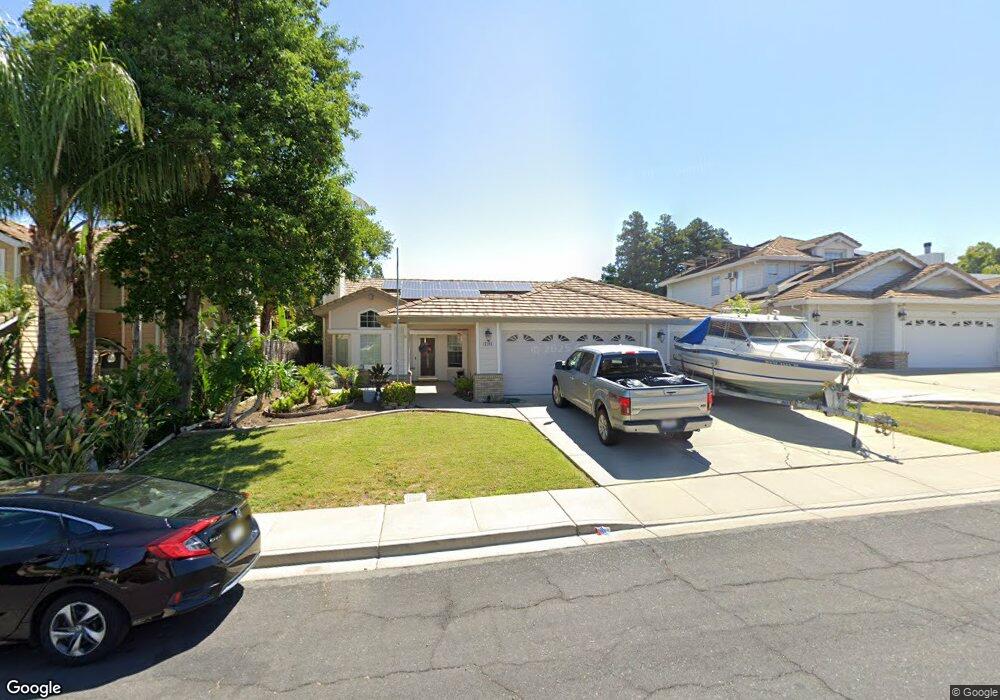
5148 Tepee Ct Antioch, CA 94531
Lone Tree Valley NeighborhoodEstimated Value: $585,242 - $707,000
4
Beds
2
Baths
1,552
Sq Ft
$404/Sq Ft
Est. Value
About This Home
This home is located at 5148 Tepee Ct, Antioch, CA 94531 and is currently estimated at $626,811, approximately $403 per square foot. 5148 Tepee Ct is a home located in Contra Costa County with nearby schools including Diablo Vista Elementary School, Dallas Ranch Middle School, and Deer Valley High School.
Ownership History
Date
Name
Owned For
Owner Type
Purchase Details
Closed on
Apr 16, 2024
Sold by
Pulaski Donald J
Bought by
Pulaski Donald J and Pulaski Aaron
Current Estimated Value
Home Financials for this Owner
Home Financials are based on the most recent Mortgage that was taken out on this home.
Original Mortgage
$437,525
Outstanding Balance
$430,988
Interest Rate
6.88%
Mortgage Type
FHA
Estimated Equity
$195,823
Purchase Details
Closed on
May 4, 2011
Sold by
Us Bank Na
Bought by
Pulaski Deborah L and Pulaski Donald J
Home Financials for this Owner
Home Financials are based on the most recent Mortgage that was taken out on this home.
Original Mortgage
$204,676
Interest Rate
4.84%
Mortgage Type
FHA
Purchase Details
Closed on
May 25, 2010
Sold by
Johnson Mark R and Johnson Cathleen A
Bought by
Us Bank Na
Purchase Details
Closed on
Sep 8, 1994
Sold by
Dale Poe Development Corp
Bought by
Johnson Mark R and Johnson Cathleen A
Home Financials for this Owner
Home Financials are based on the most recent Mortgage that was taken out on this home.
Original Mortgage
$151,000
Interest Rate
8.91%
Mortgage Type
Purchase Money Mortgage
Create a Home Valuation Report for This Property
The Home Valuation Report is an in-depth analysis detailing your home's value as well as a comparison with similar homes in the area
Home Values in the Area
Average Home Value in this Area
Purchase History
| Date | Buyer | Sale Price | Title Company |
|---|---|---|---|
| Pulaski Donald J | -- | Amrock | |
| Pulaski Deborah L | $210,000 | Chicago Title Company | |
| Us Bank Na | $181,600 | Servicelink | |
| Johnson Mark R | $159,000 | First American Title Guarant |
Source: Public Records
Mortgage History
| Date | Status | Borrower | Loan Amount |
|---|---|---|---|
| Open | Pulaski Donald J | $437,525 | |
| Previous Owner | Pulaski Deborah L | $204,676 | |
| Previous Owner | Johnson Mark R | $151,000 |
Source: Public Records
Tax History
| Year | Tax Paid | Tax Assessment Tax Assessment Total Assessment is a certain percentage of the fair market value that is determined by local assessors to be the total taxable value of land and additions on the property. | Land | Improvement |
|---|---|---|---|---|
| 2025 | $3,509 | $269,037 | $38,430 | $230,607 |
| 2024 | $3,222 | $263,763 | $37,677 | $226,086 |
| 2023 | $3,222 | $258,592 | $36,939 | $221,653 |
| 2022 | $3,175 | $253,522 | $36,215 | $217,307 |
| 2021 | $3,079 | $248,552 | $35,505 | $213,047 |
| 2019 | $2,998 | $241,181 | $34,452 | $206,729 |
| 2018 | $2,886 | $236,453 | $33,777 | $202,676 |
| 2017 | $2,821 | $231,817 | $33,115 | $198,702 |
| 2016 | $2,744 | $227,272 | $32,466 | $194,806 |
| 2015 | $2,914 | $223,859 | $31,979 | $191,880 |
| 2014 | $3,183 | $219,475 | $31,353 | $188,122 |
Source: Public Records
Map
Nearby Homes
- 5100 Sundance Ct
- 5283 Mohican Way
- 2625 Orange Way
- 5000 Morgan Way
- 5420 Golden Eagle St
- 5416 Golden Eagle St
- 5052 Perry Way
- 5200 Grass Valley Way
- 5409 Kestrel Ct
- 5408 Kestrel Ct
- 2721 Vallejo Ct
- 2510 Vallecito Way
- 2487 Stanford Way
- 5244 Kestrel St
- 5272 Kestrel St
- 5224 Kestrel St
- 5116 Hereford Ct
- 2500 Vallecito Way
- 5165 Hereford Way
- 2344 Forty Niner Ct
- 5144 Tepee Ct
- 5152 Tepee Ct
- 5146 Moccasin Way
- 5140 Tepee Ct
- 5150 Moccasin Way
- 5142 Moccasin Way
- 5156 Tepee Ct
- 5154 Moccasin Way
- 5108 Tepee Ct
- 5138 Moccasin Way
- 5104 Tepee Ct
- 5112 Tepee Ct
- 5136 Tepee Ct
- 5116 Tepee Ct
- 5100 Tepee Ct
- 5158 Moccasin Way
- 5120 Tepee Ct
- 5162 Moccasin Way
- 5109 Paddock Ct
- 5113 Moccasin Way
Your Personal Tour Guide
Ask me questions while you tour the home.