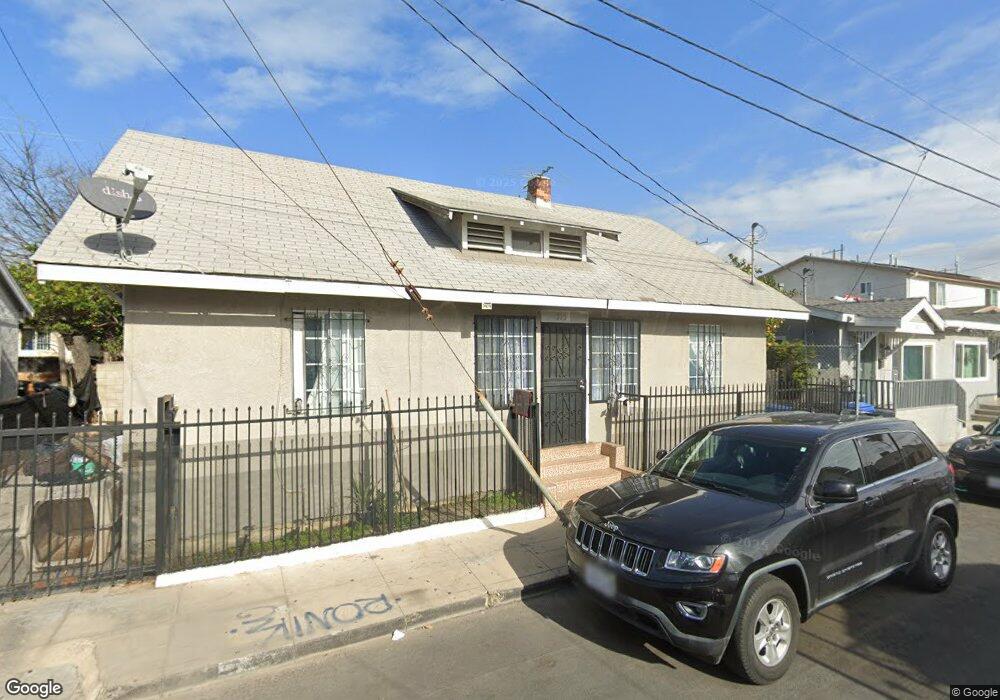
515 E 22nd St Los Angeles, CA 90011
Historic South Central NeighborhoodEstimated Value: $416,000 - $704,000
2
Beds
1
Bath
870
Sq Ft
$640/Sq Ft
Est. Value
About This Home
This home is located at 515 E 22nd St, Los Angeles, CA 90011 and is currently estimated at $556,389, approximately $639 per square foot. 515 E 22nd St is a home located in Los Angeles County with nearby schools including San Pedro Street Elementary School, John Adams Middle School, and Santee Education Complex.
Ownership History
Date
Name
Owned For
Owner Type
Purchase Details
Closed on
Feb 25, 2004
Sold by
Martinez Elena
Bought by
Cornelio Jesus
Current Estimated Value
Home Financials for this Owner
Home Financials are based on the most recent Mortgage that was taken out on this home.
Original Mortgage
$119,310
Outstanding Balance
$55,139
Interest Rate
5.62%
Mortgage Type
Purchase Money Mortgage
Estimated Equity
$501,250
Create a Home Valuation Report for This Property
The Home Valuation Report is an in-depth analysis detailing your home's value as well as a comparison with similar homes in the area
Home Values in the Area
Average Home Value in this Area
Purchase History
| Date | Buyer | Sale Price | Title Company |
|---|---|---|---|
| Cornelio Jesus | $123,000 | Land America-Commonwealth La | |
| Cornelio Jesus | -- | Commonwealth Land Title | |
| Martinez Elena | -- | Land America-Commonwealth La |
Source: Public Records
Mortgage History
| Date | Status | Borrower | Loan Amount |
|---|---|---|---|
| Open | Cornelio Jesus | $119,310 |
Source: Public Records
Tax History
| Year | Tax Paid | Tax Assessment Tax Assessment Total Assessment is a certain percentage of the fair market value that is determined by local assessors to be the total taxable value of land and additions on the property. | Land | Improvement |
|---|---|---|---|---|
| 2025 | $2,150 | $174,857 | $139,895 | $34,962 |
| 2024 | $2,150 | $171,429 | $137,152 | $34,277 |
| 2023 | $2,109 | $168,068 | $134,463 | $33,605 |
| 2022 | $2,011 | $164,774 | $131,827 | $32,947 |
| 2021 | $1,981 | $161,544 | $129,243 | $32,301 |
| 2020 | $1,997 | $159,888 | $127,918 | $31,970 |
| 2019 | $1,921 | $156,754 | $125,410 | $31,344 |
| 2018 | $1,883 | $153,681 | $122,951 | $30,730 |
| 2016 | $1,789 | $147,716 | $118,178 | $29,538 |
| 2015 | $1,763 | $145,498 | $116,403 | $29,095 |
| 2014 | $1,774 | $142,649 | $114,123 | $28,526 |
Source: Public Records
Map
Nearby Homes
Your Personal Tour Guide
Ask me questions while you tour the home.