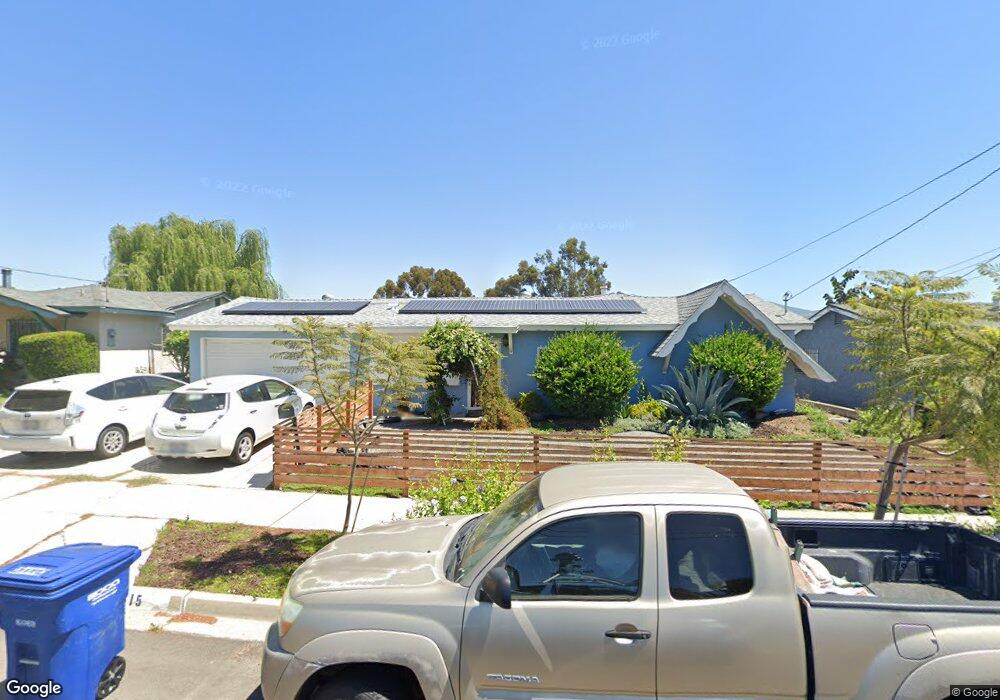
515 Osage St Spring Valley, CA 91977
Estimated Value: $686,000 - $797,000
3
Beds
2
Baths
1,054
Sq Ft
$694/Sq Ft
Est. Value
About This Home
This home is located at 515 Osage St, Spring Valley, CA 91977 and is currently estimated at $731,913, approximately $694 per square foot. 515 Osage St is a home located in San Diego County with nearby schools including Rancho Elementary School, Science, Technology, Engineering, Arts, And Math Academy, and Mount Miguel High School.
Ownership History
Date
Name
Owned For
Owner Type
Purchase Details
Closed on
Jan 17, 2017
Sold by
Kazeleski Gregory Paul and Kazeleski Dania
Bought by
Altamirano Dagoberto Aceves and Sewell Megan
Current Estimated Value
Home Financials for this Owner
Home Financials are based on the most recent Mortgage that was taken out on this home.
Original Mortgage
$384,750
Outstanding Balance
$318,863
Interest Rate
4.32%
Mortgage Type
New Conventional
Estimated Equity
$413,050
Purchase Details
Closed on
Oct 29, 2012
Sold by
Property Sales Llc
Bought by
Kazeleski Gregory Paul and Kazeleski Dania
Home Financials for this Owner
Home Financials are based on the most recent Mortgage that was taken out on this home.
Original Mortgage
$274,783
Interest Rate
3.33%
Mortgage Type
VA
Purchase Details
Closed on
Feb 14, 2012
Sold by
Laguitan Samson O
Bought by
Property Sales Llc
Create a Home Valuation Report for This Property
The Home Valuation Report is an in-depth analysis detailing your home's value as well as a comparison with similar homes in the area
Home Values in the Area
Average Home Value in this Area
Purchase History
| Date | Buyer | Sale Price | Title Company |
|---|---|---|---|
| Altamirano Dagoberto Aceves | $405,000 | Wfg National Title Company | |
| Kazeleski Gregory Paul | $269,000 | Chicago Title Company | |
| Property Sales Llc | $179,000 | None Available |
Source: Public Records
Mortgage History
| Date | Status | Borrower | Loan Amount |
|---|---|---|---|
| Open | Altamirano Dagoberto Aceves | $384,750 | |
| Previous Owner | Kazeleski Gregory Paul | $274,783 |
Source: Public Records
Tax History
| Year | Tax Paid | Tax Assessment Tax Assessment Total Assessment is a certain percentage of the fair market value that is determined by local assessors to be the total taxable value of land and additions on the property. | Land | Improvement |
|---|---|---|---|---|
| 2025 | $5,888 | $470,030 | $174,732 | $295,298 |
| 2024 | $5,888 | $460,814 | $171,306 | $289,508 |
| 2023 | $5,685 | $451,780 | $167,948 | $283,832 |
| 2022 | $5,596 | $442,922 | $164,655 | $278,267 |
| 2021 | $5,539 | $434,238 | $161,427 | $272,811 |
| 2020 | $5,318 | $429,786 | $159,772 | $270,014 |
| 2019 | $5,239 | $421,360 | $156,640 | $264,720 |
| 2018 | $5,174 | $413,099 | $153,569 | $259,530 |
| 2017 | $3,701 | $285,416 | $106,103 | $179,313 |
| 2016 | $3,562 | $279,821 | $104,023 | $175,798 |
| 2015 | $3,534 | $275,619 | $102,461 | $173,158 |
| 2014 | $3,481 | $270,221 | $100,454 | $169,767 |
Source: Public Records
Map
Nearby Homes
- 463 Parkbrook St
- 465 Parkbrook St
- 302 Worthington St
- 8582 Parkbrook St
- 524 Parkbrook St
- 220 Worthington St
- 8535 Paradise Valley Rd Unit 4
- 149 Noeline Way
- 738 Carlsbad St
- 8441 Parkbrook St
- 8364 Cacus St
- 557 Parkbrook St
- 8838 Innsdale Ave
- 753 Elkelton Blvd
- 342 Billow Dr
- 458 Ridgeway Ct
- 8115 Cacus St
- 8840 Leigh Ave Unit 12
- 510 Bluffview Rd
- 8808 Leigh Ave
Your Personal Tour Guide
Ask me questions while you tour the home.