
$1,399,995
- 3 Beds
- 2.5 Baths
- 2,759 Sq Ft
- 8184 Woodland Shore Dr
- Brighton, MI
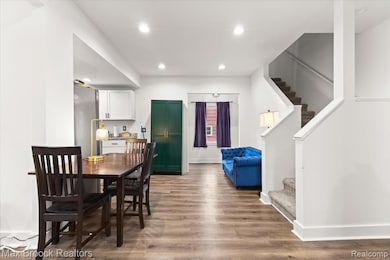
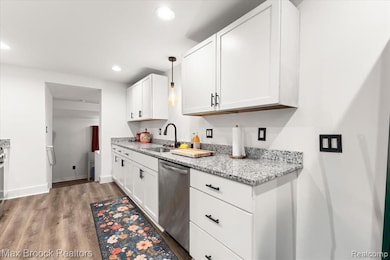
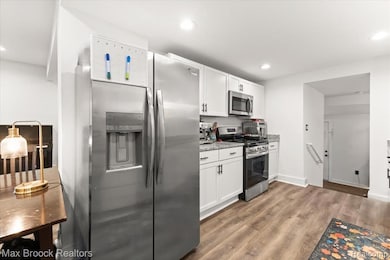
Experience the luxury of lakefront living with this magnificent custom built waterfront home. Perfectly nestled on coveted all sports Woodland Lake in one of the most sought after areas of Brighton, this truly one of a kind residence boasts an unparalleled 76 ft. of water frontage on a picturesque lot. The moment you walk through the front door you'll be mesmerized by the impeccable detail put
Chris Stefanopoulos Max Broock, REALTORS®-Bloomfield Hills