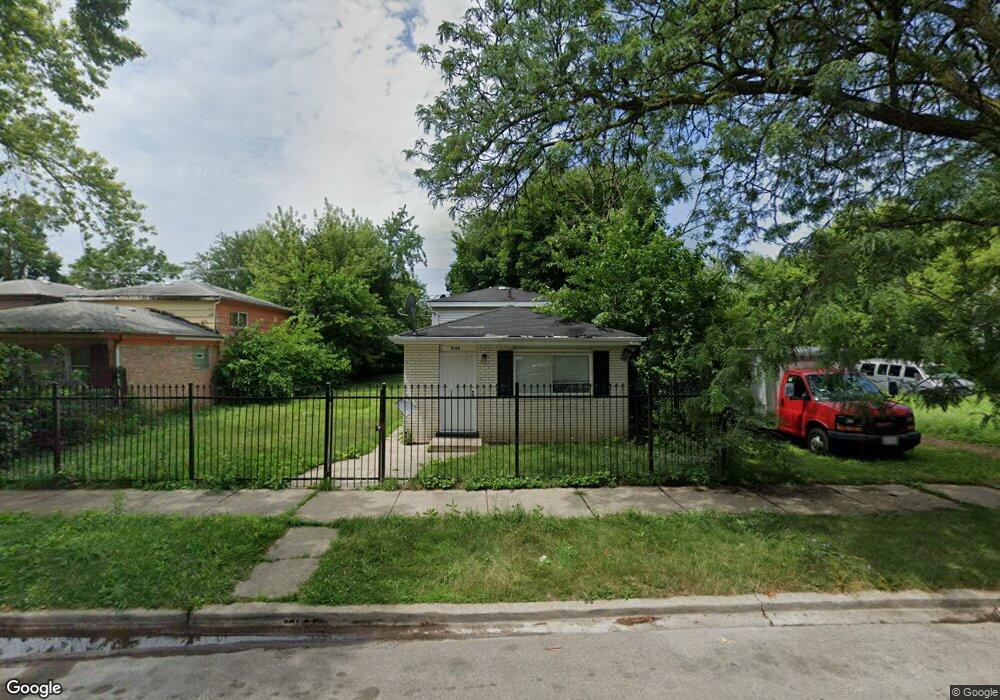
5150 S Emerald Ave Chicago, IL 60609
Back of the Yards NeighborhoodEstimated Value: $152,927 - $193,000
4
Beds
2
Baths
1,000
Sq Ft
$177/Sq Ft
Est. Value
About This Home
This home is located at 5150 S Emerald Ave, Chicago, IL 60609 and is currently estimated at $176,982, approximately $176 per square foot. 5150 S Emerald Ave is a home located in Cook County with nearby schools including Dewey Elementary Academy Of Fine Arts, KIPP Bloom Charter Elementary School, and Visitation Catholic School.
Ownership History
Date
Name
Owned For
Owner Type
Purchase Details
Closed on
Nov 4, 2011
Sold by
South Shore Rentals Llc
Bought by
South West Houses Llc
Current Estimated Value
Purchase Details
Closed on
Jul 23, 2010
Sold by
Deutsche Bank National Trust Company
Bought by
South Shore Rentals Llc
Purchase Details
Closed on
Feb 24, 2010
Sold by
Gallo Alicia
Bought by
Deutsche Bank National Trust Company
Purchase Details
Closed on
Apr 10, 2006
Sold by
Bridgeview Bank Group
Bought by
Gallo Alicia
Home Financials for this Owner
Home Financials are based on the most recent Mortgage that was taken out on this home.
Original Mortgage
$32,000
Interest Rate
6.37%
Mortgage Type
Stand Alone Second
Purchase Details
Closed on
Dec 14, 2005
Sold by
Reese
Bought by
Bridgeview Bank Group and Trust #1-3094
Create a Home Valuation Report for This Property
The Home Valuation Report is an in-depth analysis detailing your home's value as well as a comparison with similar homes in the area
Home Values in the Area
Average Home Value in this Area
Purchase History
| Date | Buyer | Sale Price | Title Company |
|---|---|---|---|
| South West Houses Llc | -- | None Available | |
| South Shore Rentals Llc | $19,000 | Parks Title | |
| Deutsche Bank National Trust Company | -- | Attorneys Title Guaranty Fun | |
| Gallo Alicia | $160,000 | Tristar Title Llc | |
| Bridgeview Bank Group | $93,000 | -- |
Source: Public Records
Mortgage History
| Date | Status | Borrower | Loan Amount |
|---|---|---|---|
| Previous Owner | Gallo Alicia | $32,000 |
Source: Public Records
Tax History Compared to Growth
Tax History
| Year | Tax Paid | Tax Assessment Tax Assessment Total Assessment is a certain percentage of the fair market value that is determined by local assessors to be the total taxable value of land and additions on the property. | Land | Improvement |
|---|---|---|---|---|
| 2024 | $844 | $8,536 | $938 | $7,598 |
| 2023 | $823 | $4,000 | $2,031 | $1,969 |
| 2022 | $823 | $4,000 | $2,031 | $1,969 |
| 2021 | $804 | $3,999 | $2,031 | $1,968 |
| 2020 | $2,777 | $12,467 | $2,031 | $10,436 |
| 2019 | $2,783 | $13,853 | $2,031 | $11,822 |
| 2018 | $2,736 | $13,853 | $2,031 | $11,822 |
| 2017 | $2,510 | $11,662 | $1,875 | $9,787 |
| 2016 | $2,336 | $11,662 | $1,875 | $9,787 |
| 2015 | $2,137 | $11,662 | $1,875 | $9,787 |
| 2014 | $1,906 | $10,274 | $1,718 | $8,556 |
| 2013 | $1,869 | $10,274 | $1,718 | $8,556 |
Source: Public Records
Map
Nearby Homes
- 5151 S Emerald Ave
- 5215 S Halsted St
- 5219 S Halsted St
- 738 W 51st St
- 5307 S Emerald Ave
- 840 W 51st Place
- 848 W 53rd St
- 845 W 50th Place
- 5302 S Peoria St
- 907 W 50th St
- 5242 S Sangamon St
- 947 W 51st St
- 949 W 51st St
- 817 W 54th St
- 841 & 843 W 51st Place
- 825 W 51st Place
- 829 W 51st Place
- 5224 S Morgan St
- 4857 S Union Ave
- 710 W Garfield Blvd
- 5148 S Emerald Ave
- 5156 S Emerald Ave
- 5158 S Emerald Ave
- 5142 S Emerald Ave
- 5140 S Emerald Ave
- 5138 S Emerald Ave
- 5201 S Emerald Ave
- 5153 S Emerald Ave
- 5132 S Emerald Ave
- 5157 S Emerald Ave
- 5130 S Emerald Ave
- 5159 S Emerald Ave
- 5141 S Emerald Ave
- 5139 S Emerald Ave
- 5137 S Emerald Ave
- 5135 S Emerald Ave
- 5210 S Emerald Ave
- 5209 S Halsted St
- 5122 S Emerald Ave
- 5131 S Emerald Ave