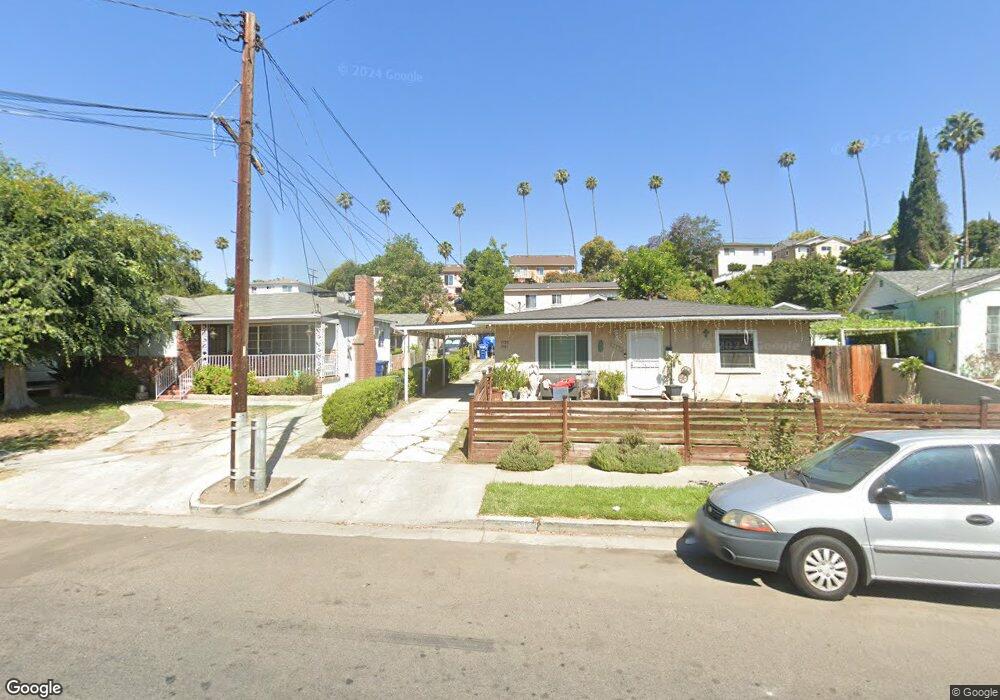
5159 Templeton St Los Angeles, CA 90032
El Sereno NeighborhoodEstimated Value: $997,072 - $1,163,000
5
Beds
3
Baths
2,588
Sq Ft
$413/Sq Ft
Est. Value
About This Home
This home is located at 5159 Templeton St, Los Angeles, CA 90032 and is currently estimated at $1,068,768, approximately $412 per square foot. 5159 Templeton St is a home located in Los Angeles County with nearby schools including Sierra Park Elementary, El Sereno Middle School, and Woodrow Wilson Senior High.
Ownership History
Date
Name
Owned For
Owner Type
Purchase Details
Closed on
Apr 10, 2006
Sold by
Chaidez Sonia
Bought by
Chaidez Sonia and Nesta Jorge
Current Estimated Value
Home Financials for this Owner
Home Financials are based on the most recent Mortgage that was taken out on this home.
Original Mortgage
$492,000
Outstanding Balance
$291,493
Interest Rate
7%
Mortgage Type
New Conventional
Estimated Equity
$777,275
Purchase Details
Closed on
Mar 24, 2006
Sold by
Lomonaco Gus F and Lomonaco Diane
Bought by
Chaidez Sonia
Home Financials for this Owner
Home Financials are based on the most recent Mortgage that was taken out on this home.
Original Mortgage
$492,000
Outstanding Balance
$291,493
Interest Rate
7%
Mortgage Type
New Conventional
Estimated Equity
$777,275
Purchase Details
Closed on
Dec 16, 1993
Sold by
Lomonaco Diane
Bought by
Lomonaco Gus F and Lomonaco Diane
Create a Home Valuation Report for This Property
The Home Valuation Report is an in-depth analysis detailing your home's value as well as a comparison with similar homes in the area
Home Values in the Area
Average Home Value in this Area
Purchase History
| Date | Buyer | Sale Price | Title Company |
|---|---|---|---|
| Chaidez Sonia | -- | None Available | |
| Chaidez Sonia | $615,000 | Investors Title | |
| Lomonaco Gus F | -- | -- |
Source: Public Records
Mortgage History
| Date | Status | Borrower | Loan Amount |
|---|---|---|---|
| Open | Chaidez Sonia | $492,000 |
Source: Public Records
Tax History Compared to Growth
Tax History
| Year | Tax Paid | Tax Assessment Tax Assessment Total Assessment is a certain percentage of the fair market value that is determined by local assessors to be the total taxable value of land and additions on the property. | Land | Improvement |
|---|---|---|---|---|
| 2025 | $10,470 | $840,434 | $573,957 | $266,477 |
| 2024 | $10,470 | $823,955 | $562,703 | $261,252 |
| 2023 | $10,224 | $807,800 | $551,670 | $256,130 |
| 2022 | $9,759 | $791,961 | $540,853 | $251,108 |
| 2021 | $9,633 | $776,434 | $530,249 | $246,185 |
| 2020 | $9,727 | $768,473 | $524,812 | $243,661 |
| 2019 | $9,352 | $753,406 | $514,522 | $238,884 |
| 2018 | $9,219 | $738,634 | $504,434 | $234,200 |
| 2016 | $8,029 | $645,000 | $439,100 | $205,900 |
| 2015 | $7,673 | $615,000 | $418,700 | $196,300 |
| 2014 | $7,861 | $615,000 | $418,700 | $196,300 |
Source: Public Records
Map
Nearby Homes
- 5158 Templeton St
- 3323 Linda Vista Terrace
- 3216 Warwick Ave
- 3204 Pueblo Ave
- 3424 Pueblo Ave Unit 8
- 5059 Lynnfield St
- 3100 Pueblo Ave
- 5213 Navarro St
- 5160 Oakland St
- 3202 Farnsworth Ave
- 4962 Gambier St
- 4926 Templeton St
- 3233 Dorchester Ave
- 3339 Dorchester Ave
- 2871 Budau Ave Unit 2
- 5437 Norwich Ave
- 5436 Norwich Ave
- 5013 Huntington Dr N
- 2815 N Round
- 2721 N Onyxdr
- 5155 Templeton St
- 5167 Templeton St
- 5151 Templeton St
- 5171 Templeton St
- 0 Vacant Land Unit AR17265592
- 0 Vacant Land Unit A09048604
- 0 Vacant Land Unit A09048601
- 0 Vacant Land Unit Y1104348
- 0 Vacant Land Unit Y1203518
- 0 Apn#5309-012-007 Unit PW13189596
- 0 Vacant Land Unit SB22228631
- 3346 Linda Vista Terrace
- 5143 Templeton St
- 3340 Linda Vista Terrace
- 5175 Templeton St
- 5164 Templeton St
- 3400 Linda Vista Terrace
- 3334 Linda Vista Terrace
- 5170 Templeton St
- 3408 Linda Vista Terrace