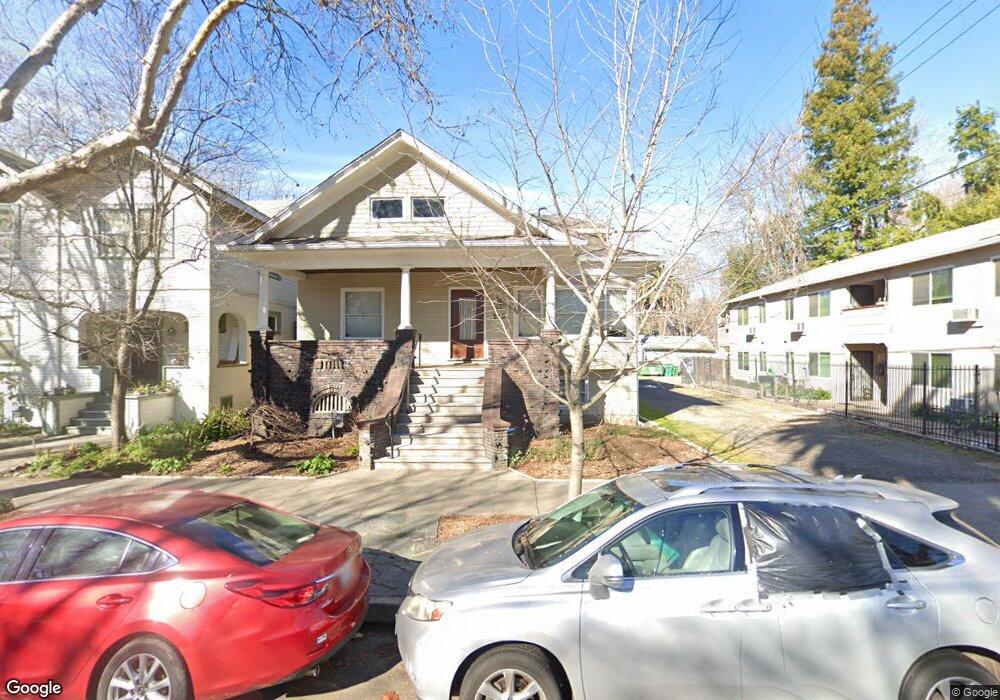
516 21st St Sacramento, CA 95811
Boulevard Park NeighborhoodEstimated Value: $703,000 - $1,004,000
2
Beds
2
Baths
1,746
Sq Ft
$487/Sq Ft
Est. Value
About This Home
This home is located at 516 21st St, Sacramento, CA 95811 and is currently estimated at $850,173, approximately $486 per square foot. 516 21st St is a home located in Sacramento County with nearby schools including Washington Elementary, Miwok Middle School, and C. K. McClatchy High.
Ownership History
Date
Name
Owned For
Owner Type
Purchase Details
Closed on
Dec 3, 2009
Sold by
Decuir Ricci Raymond and Richard Hill & Janice Hill Tru
Bought by
Fullerton David and Reimer Daphne
Current Estimated Value
Home Financials for this Owner
Home Financials are based on the most recent Mortgage that was taken out on this home.
Original Mortgage
$266,400
Outstanding Balance
$173,851
Interest Rate
4.91%
Mortgage Type
New Conventional
Estimated Equity
$676,323
Purchase Details
Closed on
Sep 22, 2005
Sold by
Hill Janice L and Hill Richard
Bought by
Hill Janice Laverne and Hill Richard Edward
Purchase Details
Closed on
Jun 15, 2005
Sold by
Hill Janice L
Bought by
Hill Richard and Hill Janice L
Home Financials for this Owner
Home Financials are based on the most recent Mortgage that was taken out on this home.
Original Mortgage
$469,342
Interest Rate
4.8%
Mortgage Type
Reverse Mortgage Home Equity Conversion Mortgage
Create a Home Valuation Report for This Property
The Home Valuation Report is an in-depth analysis detailing your home's value as well as a comparison with similar homes in the area
Home Values in the Area
Average Home Value in this Area
Purchase History
| Date | Buyer | Sale Price | Title Company |
|---|---|---|---|
| Fullerton David | $333,000 | Commerce Title Company | |
| Hill Janice Laverne | -- | -- | |
| Hill Richard | -- | Alliance Title Company |
Source: Public Records
Mortgage History
| Date | Status | Borrower | Loan Amount |
|---|---|---|---|
| Open | Fullerton David | $266,400 | |
| Previous Owner | Hill Richard | $469,342 |
Source: Public Records
Tax History Compared to Growth
Tax History
| Year | Tax Paid | Tax Assessment Tax Assessment Total Assessment is a certain percentage of the fair market value that is determined by local assessors to be the total taxable value of land and additions on the property. | Land | Improvement |
|---|---|---|---|---|
| 2025 | $5,565 | $467,512 | $136,820 | $330,692 |
| 2024 | $5,565 | $458,346 | $134,138 | $324,208 |
| 2023 | $5,434 | $449,359 | $131,508 | $317,851 |
| 2022 | $5,342 | $440,549 | $128,930 | $311,619 |
| 2021 | $5,093 | $431,911 | $126,402 | $305,509 |
| 2020 | $5,132 | $427,483 | $125,106 | $302,377 |
| 2019 | $5,023 | $419,102 | $122,653 | $296,449 |
| 2018 | $4,893 | $410,886 | $120,249 | $290,637 |
| 2017 | $4,827 | $402,831 | $117,892 | $284,939 |
| 2016 | $4,630 | $394,933 | $115,581 | $279,352 |
| 2015 | $4,531 | $389,001 | $113,845 | $275,156 |
| 2014 | $4,407 | $381,382 | $111,615 | $269,767 |
Source: Public Records
Map
Nearby Homes