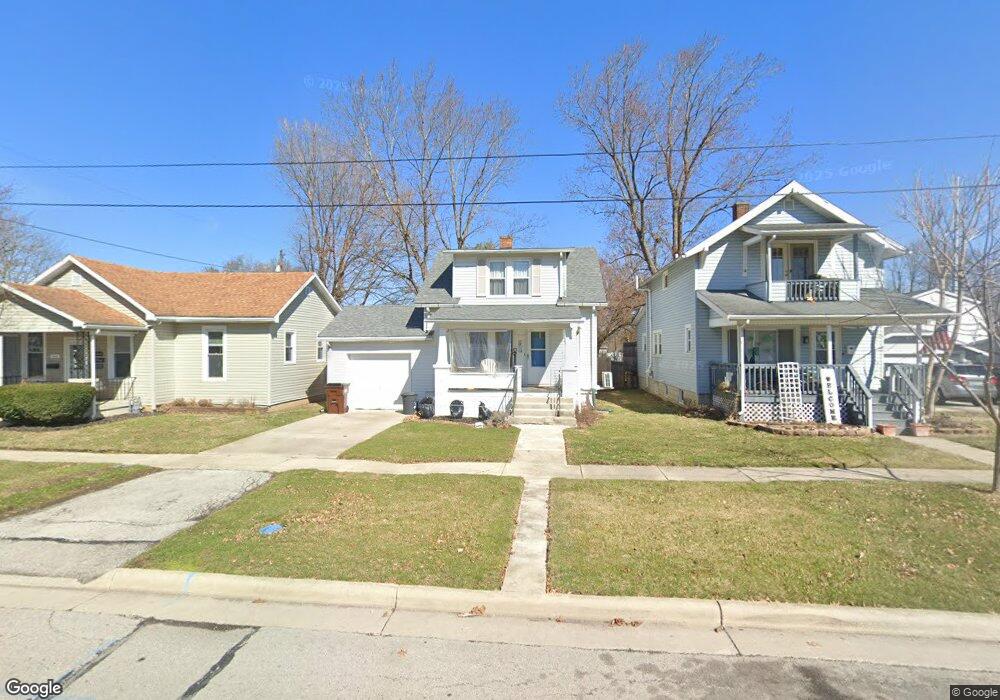
516 2nd St Findlay, OH 45840
Estimated Value: $134,705 - $161,000
2
Beds
1
Bath
900
Sq Ft
$159/Sq Ft
Est. Value
About This Home
This home is located at 516 2nd St, Findlay, OH 45840 and is currently estimated at $142,926, approximately $158 per square foot. 516 2nd St is a home located in Hancock County with nearby schools including Lincoln Elementary School, Donnell Middle School, and Findlay High School.
Ownership History
Date
Name
Owned For
Owner Type
Purchase Details
Closed on
Feb 4, 2000
Sold by
Robinson Marcia A
Bought by
Abell Dawn W
Current Estimated Value
Home Financials for this Owner
Home Financials are based on the most recent Mortgage that was taken out on this home.
Original Mortgage
$64,900
Outstanding Balance
$21,172
Interest Rate
7.98%
Mortgage Type
New Conventional
Estimated Equity
$121,754
Purchase Details
Closed on
Sep 16, 1981
Bought by
Robinson Max A and Robinson Marcia A
Create a Home Valuation Report for This Property
The Home Valuation Report is an in-depth analysis detailing your home's value as well as a comparison with similar homes in the area
Home Values in the Area
Average Home Value in this Area
Purchase History
| Date | Buyer | Sale Price | Title Company |
|---|---|---|---|
| Abell Dawn W | $64,900 | -- | |
| Robinson Max A | -- | -- |
Source: Public Records
Mortgage History
| Date | Status | Borrower | Loan Amount |
|---|---|---|---|
| Open | Abell Dawn W | $64,900 |
Source: Public Records
Tax History Compared to Growth
Tax History
| Year | Tax Paid | Tax Assessment Tax Assessment Total Assessment is a certain percentage of the fair market value that is determined by local assessors to be the total taxable value of land and additions on the property. | Land | Improvement |
|---|---|---|---|---|
| 2024 | $1,167 | $32,840 | $4,170 | $28,670 |
| 2023 | $1,168 | $32,840 | $4,170 | $28,670 |
| 2022 | $1,164 | $32,840 | $4,170 | $28,670 |
| 2021 | $1,137 | $27,930 | $4,170 | $23,760 |
| 2020 | $1,137 | $27,930 | $4,170 | $23,760 |
| 2019 | $1,090 | $27,340 | $4,170 | $23,170 |
| 2018 | $1,042 | $23,940 | $3,790 | $20,150 |
| 2017 | $520 | $23,940 | $3,790 | $20,150 |
| 2016 | $1,036 | $23,940 | $3,790 | $20,150 |
| 2015 | $572 | $13,090 | $1,900 | $11,190 |
| 2014 | $572 | $13,090 | $1,900 | $11,190 |
| 2012 | $547 | $12,350 | $1,900 | $10,450 |
Source: Public Records
Map
Nearby Homes
- 1109 Park St
- 420 1st St
- 817 Park St
- 904 Morse St
- 202 Hancock St
- 829 Maple Ave
- 123 Glendale Ave
- 804 6th St
- 820 Selby St
- 1109 Brookside Dr
- 1011 Stall Dr
- 1008 Eastview Dr
- 225 Lima Ave
- 905 S West St
- 1115 Liberty St
- 1727 Washington Ave
- 15591 Canadian Way
- 15586 Canadian Way
- 15615 Canadian Way
- 1621 S Main St