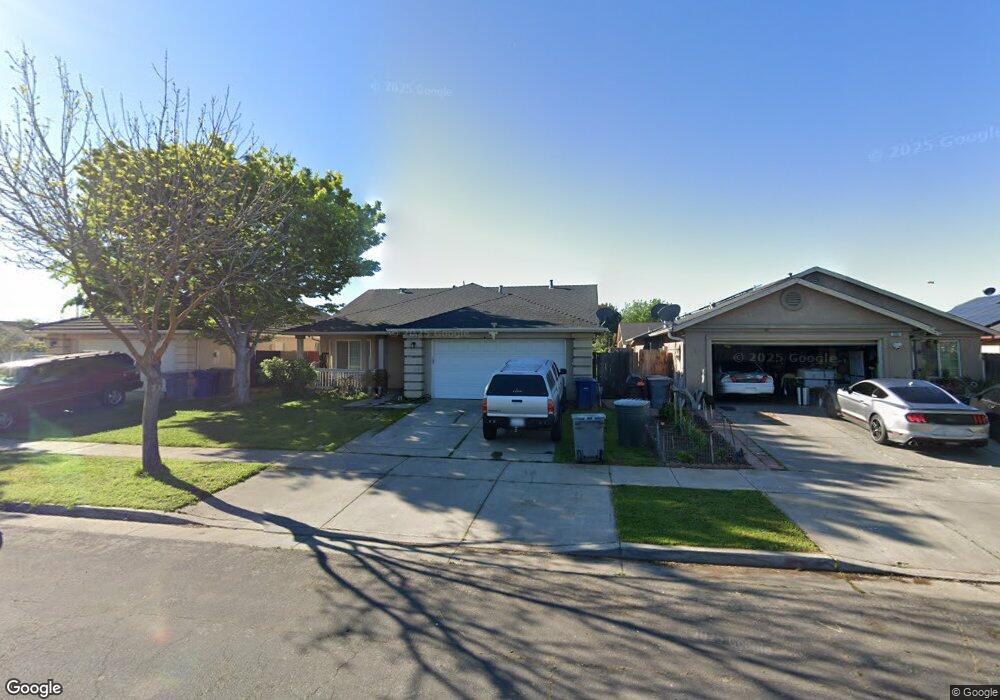
516 Brittany Way Merced, CA 95341
South Merced NeighborhoodEstimated Value: $315,000 - $376,000
3
Beds
2
Baths
1,250
Sq Ft
$282/Sq Ft
Est. Value
About This Home
This home is located at 516 Brittany Way, Merced, CA 95341 and is currently estimated at $352,634, approximately $282 per square foot. 516 Brittany Way is a home located in Merced County with nearby schools including Farmdale Elementary School, Weaver Middle School, and El Capitan High School.
Ownership History
Date
Name
Owned For
Owner Type
Purchase Details
Closed on
May 3, 2010
Sold by
Orchard Terrace Estates Llc
Bought by
Yeh Hsiang Kang and Yeh Chao Tung
Current Estimated Value
Purchase Details
Closed on
Mar 19, 2010
Sold by
Vantruong Cameron
Bought by
Orchard Terrace Estates Llc
Purchase Details
Closed on
Sep 13, 2005
Sold by
Truong Thong and Pham Amy
Bought by
Vantruong Cameron
Home Financials for this Owner
Home Financials are based on the most recent Mortgage that was taken out on this home.
Original Mortgage
$176,000
Interest Rate
6.37%
Mortgage Type
Fannie Mae Freddie Mac
Purchase Details
Closed on
Aug 24, 2004
Sold by
Cypress Terrace Estates Llc
Bought by
Truong Thong and Pham Amy
Home Financials for this Owner
Home Financials are based on the most recent Mortgage that was taken out on this home.
Original Mortgage
$191,000
Interest Rate
7.25%
Mortgage Type
Purchase Money Mortgage
Create a Home Valuation Report for This Property
The Home Valuation Report is an in-depth analysis detailing your home's value as well as a comparison with similar homes in the area
Home Values in the Area
Average Home Value in this Area
Purchase History
| Date | Buyer | Sale Price | Title Company |
|---|---|---|---|
| Yeh Hsiang Kang | -- | Fidelity Natl Title Co Of Ca | |
| Orchard Terrace Estates Llc | $76,537 | Fidelity Title Company | |
| Vantruong Cameron | $220,000 | Stewart Title Of Ca Inc | |
| Truong Thong | $214,500 | Fidelity Title Company |
Source: Public Records
Mortgage History
| Date | Status | Borrower | Loan Amount |
|---|---|---|---|
| Previous Owner | Vantruong Cameron | $176,000 | |
| Previous Owner | Truong Thong | $191,000 |
Source: Public Records
Tax History Compared to Growth
Tax History
| Year | Tax Paid | Tax Assessment Tax Assessment Total Assessment is a certain percentage of the fair market value that is determined by local assessors to be the total taxable value of land and additions on the property. | Land | Improvement |
|---|---|---|---|---|
| 2025 | $1,631 | $131,649 | $10,320 | $121,329 |
| 2024 | $1,631 | $129,068 | $10,118 | $118,950 |
| 2023 | $1,522 | $126,538 | $9,920 | $116,618 |
| 2022 | $1,556 | $124,058 | $9,726 | $114,332 |
| 2021 | $1,621 | $121,627 | $9,536 | $112,091 |
| 2020 | $1,491 | $120,381 | $9,439 | $110,942 |
| 2019 | $1,456 | $118,021 | $9,254 | $108,767 |
| 2018 | $1,417 | $115,708 | $9,073 | $106,635 |
| 2017 | $1,387 | $113,441 | $8,896 | $104,545 |
| 2016 | $1,418 | $111,218 | $8,722 | $102,496 |
| 2015 | $1,353 | $109,548 | $8,591 | $100,957 |
| 2014 | $1,329 | $107,403 | $8,423 | $98,980 |
Source: Public Records
Map
Nearby Homes
- 506 Janell Ct
- 137 W Gerard Ave
- 634 Amanda Ct
- 747 Brianne Ct
- 767 Taryn Ct
- 527 Seville Way
- 627 Elizabeth Ct
- 236 Cone Ave
- 184 Parkwest St
- 603 Cadiz Ave
- 107 El Verano Ct
- 0 S R St
- 124 E San Pedro St
- 130 Mcgregor St
- The Haven Plan at Stone Ridge West
- The Sierra Plan at Stone Ridge West
- The Kelsey Plan at Stone Ridge West
- 761 Ave
- 122 Ornelas Trail Ln
- 142 Ornelas Trail Ln
- 532 Brittany Way
- 508 Brittany Way
- 546 Brittany Way
- 511 Deborah Ct
- 527 Deborah Ct
- 505 Deborah Ct
- 531 Deborah Ct
- 550 Brittany Way
- 529 Brittany Way
- 531 Brittany Way
- 511 Brittany Way
- 496 Brittany Way
- 553 Deborah Ct
- 549 Brittany Way
- 564 Brittany Way
- 495 Tucolay Ct
- 553 Brittany Way
- 561 Deborah Ct
- 488 Brittany Way
- 493 Brittany Way