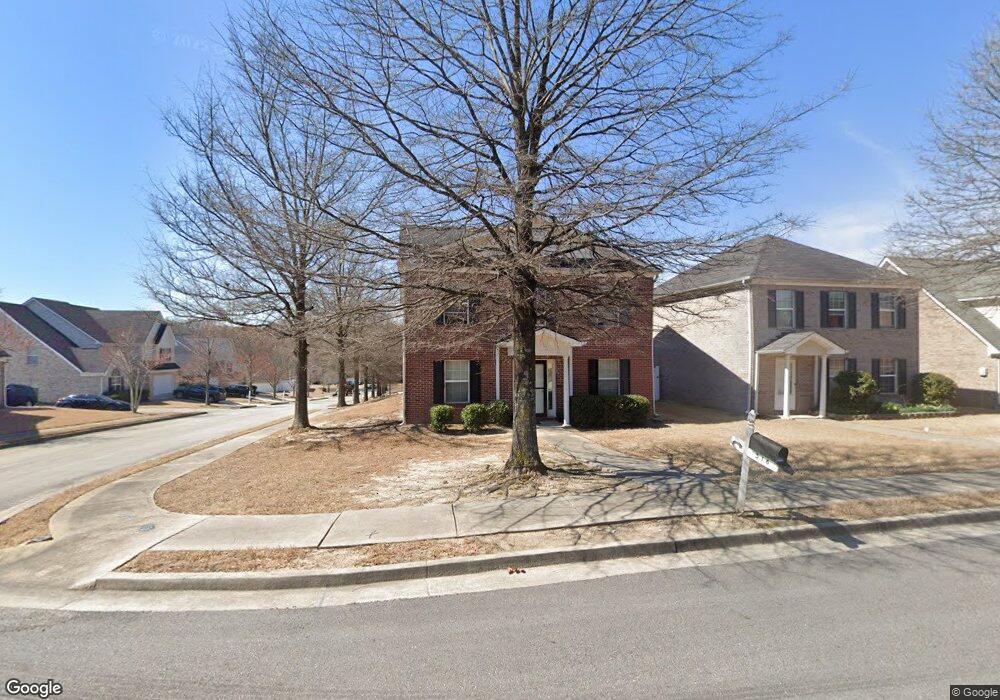
516 Townsend Bend Stockbridge, GA 30281
Estimated Value: $284,880 - $311,000
4
Beds
3
Baths
2,582
Sq Ft
$114/Sq Ft
Est. Value
About This Home
This home is located at 516 Townsend Bend, Stockbridge, GA 30281 and is currently estimated at $294,470, approximately $114 per square foot. 516 Townsend Bend is a home located in Henry County with nearby schools including Stockbridge Elementary School, Smith-Barnes Elementary School, and Stockbridge Middle School.
Ownership History
Date
Name
Owned For
Owner Type
Purchase Details
Closed on
Jun 17, 2010
Sold by
Cwabs Inc Series 2007-2
Bought by
Lyles Marlon L and Lyles Ashonte S
Current Estimated Value
Home Financials for this Owner
Home Financials are based on the most recent Mortgage that was taken out on this home.
Original Mortgage
$85,500
Outstanding Balance
$56,737
Interest Rate
4.77%
Mortgage Type
New Conventional
Estimated Equity
$237,733
Purchase Details
Closed on
Nov 3, 2009
Sold by
Pygeol Lykisha
Bought by
Cwabs Inc
Purchase Details
Closed on
Jun 22, 2005
Sold by
Pygeol Lykisha R
Bought by
Pygeol Lykisha R and Pygeol Jerry
Home Financials for this Owner
Home Financials are based on the most recent Mortgage that was taken out on this home.
Original Mortgage
$32,780
Interest Rate
5.57%
Mortgage Type
New Conventional
Purchase Details
Closed on
Nov 3, 2004
Sold by
Dra Dev Inc
Bought by
Edson Homes Llc
Home Financials for this Owner
Home Financials are based on the most recent Mortgage that was taken out on this home.
Original Mortgage
$120,000
Interest Rate
5.77%
Create a Home Valuation Report for This Property
The Home Valuation Report is an in-depth analysis detailing your home's value as well as a comparison with similar homes in the area
Home Values in the Area
Average Home Value in this Area
Purchase History
| Date | Buyer | Sale Price | Title Company |
|---|---|---|---|
| Lyles Marlon L | $95,000 | -- | |
| Cwabs Inc | $112,050 | -- | |
| Pygeol Lykisha R | -- | -- | |
| Edson Homes Llc | $40,000 | -- |
Source: Public Records
Mortgage History
| Date | Status | Borrower | Loan Amount |
|---|---|---|---|
| Open | Lyles Marlon L | $85,500 | |
| Previous Owner | Pygeol Lykisha R | $32,780 | |
| Previous Owner | Edson Homes Llc | $120,000 |
Source: Public Records
Tax History Compared to Growth
Tax History
| Year | Tax Paid | Tax Assessment Tax Assessment Total Assessment is a certain percentage of the fair market value that is determined by local assessors to be the total taxable value of land and additions on the property. | Land | Improvement |
|---|---|---|---|---|
| 2025 | $5,053 | $122,560 | $16,000 | $106,560 |
| 2024 | $5,053 | $121,240 | $16,000 | $105,240 |
| 2023 | $5,344 | $127,040 | $18,000 | $109,040 |
| 2022 | $4,173 | $103,240 | $12,800 | $90,440 |
| 2021 | $2,993 | $76,360 | $12,800 | $63,560 |
| 2020 | $2,993 | $72,240 | $12,800 | $59,440 |
| 2019 | $163 | $65,920 | $10,000 | $55,920 |
| 2018 | $2,027 | $61,800 | $10,000 | $51,800 |
| 2016 | $1,844 | $54,040 | $8,000 | $46,040 |
| 2015 | $1,975 | $45,800 | $7,640 | $38,160 |
| 2014 | $1,811 | $41,160 | $4,800 | $36,360 |
Source: Public Records
Map
Nearby Homes
- 677 Armitage Way
- 172 Willow Springs Ln
- 5005 Kens Ct
- 328 Spring Creek Dr
- 1120 Northern Run
- 236 Northbridge Dr
- 0 Hwy 138 Unit 7635399
- 0 Hwy 138 Unit 13974666
- 0 Hwy 138 Unit 10587482
- 200 Ernestine Way
- 568 Ransom Way
- 705 Brentwood Pkwy
- 173 Brush Creek Ct
- 193 Brush Creek Ct
- 197 Brush Creek Ct
- 201 Brush Creek Ct
- 0 Daniel Dr Unit 10628491
- 157 Black Forest Trail
- 404 Northwind Place
- 0 Shields Rd Unit 10536569
- 512 Townsend Bend
- 508 Townsend Bend
- 913 Hollybrook Dr
- 520 Townsend Bend
- 504 Townsend Bend
- 909 Hollybrook Dr
- 524 Townsend Bend
- 908 Hollybrook Dr
- 477 Townsend Bend
- 477 Townsend Bend Unit 1B
- 481 Townsend Bend
- 812 Winsap Dr
- 473 Townsend Bend
- 500 Townsend Bend
- 485 Townsend Bend
- 905 Hollybrook Dr
- 904 Hollybrook Dr
- 469 Townsend Bend
- 469 Townsend Bend Unit 141
- 528 Townsend Bend