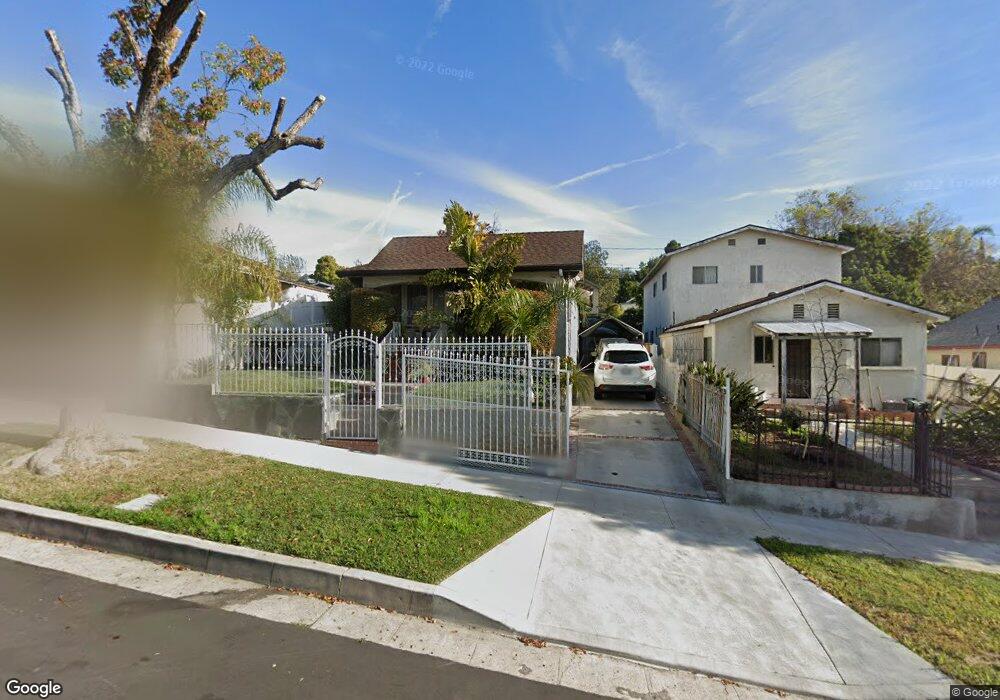
5163 Almaden Dr Los Angeles, CA 90042
Estimated Value: $728,000 - $1,136,000
2
Beds
2
Baths
1,384
Sq Ft
$738/Sq Ft
Est. Value
About This Home
This home is located at 5163 Almaden Dr, Los Angeles, CA 90042 and is currently estimated at $1,021,101, approximately $737 per square foot. 5163 Almaden Dr is a home located in Los Angeles County with nearby schools including Buchanan Street Elementary, Benjamin Franklin High School, and Luther Burbank Middle School.
Ownership History
Date
Name
Owned For
Owner Type
Purchase Details
Closed on
Feb 28, 2010
Sold by
Martinez Paulo
Bought by
Bonilla Sergio and Bonilla Josefina
Current Estimated Value
Home Financials for this Owner
Home Financials are based on the most recent Mortgage that was taken out on this home.
Original Mortgage
$210,000
Outstanding Balance
$139,114
Interest Rate
4.97%
Mortgage Type
New Conventional
Estimated Equity
$881,987
Purchase Details
Closed on
Dec 17, 1997
Sold by
Federal National Mortgage Association
Bought by
Bonilla Sergio and Bonilla Josefina
Home Financials for this Owner
Home Financials are based on the most recent Mortgage that was taken out on this home.
Original Mortgage
$114,495
Interest Rate
7.13%
Mortgage Type
FHA
Purchase Details
Closed on
May 15, 1997
Sold by
Sanchez Juan R and Federal National Mortgage Asso
Bought by
Federal National Mortgage Association
Create a Home Valuation Report for This Property
The Home Valuation Report is an in-depth analysis detailing your home's value as well as a comparison with similar homes in the area
Home Values in the Area
Average Home Value in this Area
Purchase History
| Date | Buyer | Sale Price | Title Company |
|---|---|---|---|
| Bonilla Sergio | -- | Lawyers | |
| Bonilla Sergio | $115,000 | Commonwealth Land Title Co | |
| Federal National Mortgage Association | $115,000 | Chicago Title Company |
Source: Public Records
Mortgage History
| Date | Status | Borrower | Loan Amount |
|---|---|---|---|
| Open | Bonilla Sergio | $210,000 | |
| Previous Owner | Bonilla Sergio | $114,495 |
Source: Public Records
Tax History Compared to Growth
Tax History
| Year | Tax Paid | Tax Assessment Tax Assessment Total Assessment is a certain percentage of the fair market value that is determined by local assessors to be the total taxable value of land and additions on the property. | Land | Improvement |
|---|---|---|---|---|
| 2025 | $3,369 | $263,995 | $213,463 | $50,532 |
| 2024 | $3,369 | $258,820 | $209,278 | $49,542 |
| 2023 | $3,307 | $253,746 | $205,175 | $48,571 |
| 2022 | $3,158 | $248,771 | $201,152 | $47,619 |
| 2021 | $3,114 | $243,894 | $197,208 | $46,686 |
| 2020 | $3,142 | $241,394 | $195,186 | $46,208 |
| 2019 | $3,024 | $236,661 | $191,359 | $45,302 |
| 2018 | $2,939 | $232,021 | $187,607 | $44,414 |
| 2017 | $2,874 | $227,473 | $183,929 | $43,544 |
| 2016 | $2,798 | $223,014 | $180,323 | $42,691 |
| 2015 | $2,758 | $219,665 | $177,615 | $42,050 |
| 2014 | $2,780 | $215,363 | $174,136 | $41,227 |
Source: Public Records
Map
Nearby Homes
- 5252 Range View Ave
- 5117 Stratford Rd
- 1813 N Avenue 53
- 5240 Barker Dr
- 1813 N Avenue 55
- 1932 Phillips Way
- 5318 Raber St
- 1942 Phillips Way
- 1938 Phillips Way
- 1915 N Avenue 52
- 1902 N Avenue 51
- 5125 Buchanan St
- 1815 Nolden St
- 1370 N Avenue 57
- 1333 Wildwood Dr
- 4925 Buchanan St
- 1113 N Avenue 50
- 1632 Oak Grove Dr
- 5055 Hub St
- 829 N Avenue 53
- 5159 Almaden Dr
- 5203 Almaden Dr
- 5153 Almaden Dr
- 5205 Almaden Dr
- 5151 Almaden Dr
- 5149 Almaden Dr
- 5211 Almaden Dr
- 5211 Almaden Dr
- 5226 Coringa Dr
- 5230 Coringa Dr
- 5222 Coringa Dr
- 5234 Coringa Dr
- 5218 Coringa Dr
- 5215 Almaden Dr
- 5147 Almaden Dr
- 5238 Coringa Dr
- 5214 Coringa Dr
- 5162 Almaden Dr
- 5202 Almaden Dr
- 5143 Almaden Dr