5165 N Via Amore Fresno, CA 93711
Van Ness Extension NeighborhoodEstimated Value: $529,318 - $646,000
3
Beds
3
Baths
1,870
Sq Ft
$311/Sq Ft
Est. Value
About This Home
This home is located at 5165 N Via Amore, Fresno, CA 93711 and is currently estimated at $581,580, approximately $311 per square foot. 5165 N Via Amore is a home located in Fresno County with nearby schools including Malloch Elementary School, Tenaya Middle School, and Bullard High School.
Ownership History
Date
Name
Owned For
Owner Type
Purchase Details
Closed on
May 13, 2009
Sold by
Matthes Kathleen J and Matthes Kathleen J Tharp
Bought by
Matthes Kathleen J
Current Estimated Value
Purchase Details
Closed on
Feb 1, 2007
Sold by
Steffen William C and Steffen Mary J
Bought by
Matthes Kathleen J Tharp
Purchase Details
Closed on
Feb 10, 2004
Sold by
Ruether Bonnie M
Bought by
Steffen William C and Steffen Mary J
Home Financials for this Owner
Home Financials are based on the most recent Mortgage that was taken out on this home.
Original Mortgage
$267,200
Interest Rate
4.37%
Mortgage Type
New Conventional
Purchase Details
Closed on
Apr 23, 2001
Sold by
Ruether Bonnie M
Bought by
Ruether Bonnie M
Purchase Details
Closed on
Feb 11, 1999
Sold by
Wathen Castanos Inc
Bought by
Ruether Richard A and Ruether Bonnie M
Create a Home Valuation Report for This Property
The Home Valuation Report is an in-depth analysis detailing your home's value as well as a comparison with similar homes in the area
Home Values in the Area
Average Home Value in this Area
Purchase History
| Date | Buyer | Sale Price | Title Company |
|---|---|---|---|
| Matthes Kathleen J | -- | None Available | |
| Matthes Kathleen J Tharp | $465,000 | Fidelity National Title Co | |
| Steffen William C | $334,000 | Fidelity National Title Co | |
| Ruether Bonnie M | -- | -- | |
| Ruether Richard A | $209,000 | Chicago Title Co |
Source: Public Records
Mortgage History
| Date | Status | Borrower | Loan Amount |
|---|---|---|---|
| Previous Owner | Steffen William C | $267,200 |
Source: Public Records
Tax History Compared to Growth
Tax History
| Year | Tax Paid | Tax Assessment Tax Assessment Total Assessment is a certain percentage of the fair market value that is determined by local assessors to be the total taxable value of land and additions on the property. | Land | Improvement |
|---|---|---|---|---|
| 2025 | $6,236 | $510,000 | $140,000 | $370,000 |
| 2023 | $6,158 | $490,900 | $128,300 | $362,600 |
| 2022 | $6,014 | $476,700 | $124,600 | $352,100 |
| 2021 | $5,090 | $407,500 | $106,500 | $301,000 |
| 2020 | $4,651 | $370,600 | $96,900 | $273,700 |
| 2019 | $4,363 | $354,800 | $92,800 | $262,000 |
| 2018 | $4,225 | $344,500 | $90,100 | $254,400 |
| 2017 | $3,992 | $325,000 | $85,000 | $240,000 |
| 2016 | $3,640 | $300,900 | $71,100 | $229,800 |
| 2015 | $3,447 | $285,300 | $67,400 | $217,900 |
| 2014 | $3,226 | $267,300 | $63,200 | $204,100 |
Source: Public Records
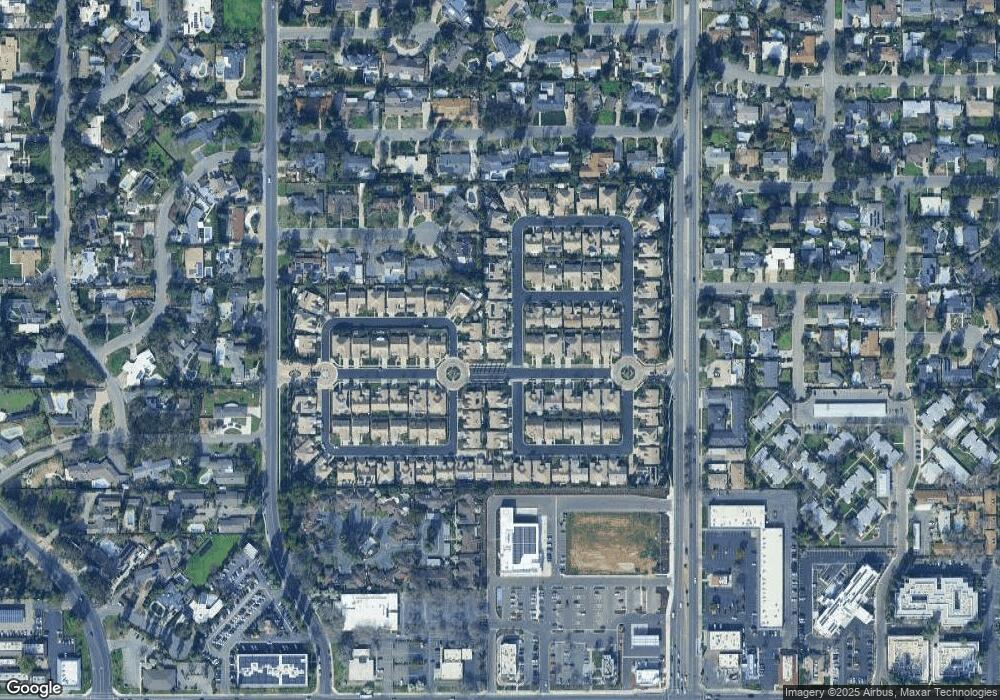
Map
Nearby Homes
- 5125 N Via Amore
- 5072 N Forkner Ave
- 5088 N Forkner Ave
- 5124 N Via Trevi
- 2190 W Via Cipressi
- 2044 W San Bruno Ave
- 5180 N Channing Way
- 2059 W Barstow Ave
- 4914 N Sequoia Dr
- 5375 N Forkner Ave
- 1110 W Fairmont Ave
- 5287 N Sequoia Dr
- 1582 W San Jose Ave
- 4908 N Sequoia Ave Unit 102
- 1720 W Barstow Ave
- 4880 N Hulbert Ave Unit 101
- 4848 N Hulbert Ave Unit 102
- 2013 W Fairmont Ave
- 4856 N Hulbert Ave Unit 101
- 1685 W Robinwood Ln
- 5175 N Via Amore
- 2106 W Via Cipressi
- 2114 W Via Cipressi
- 2078 W Via Le Fontane
- 5185 N Via Amore
- 5145 N Via Amore
- 2079 W Via Lante
- 2105 W Via Delfini
- 2066 W Via Le Fontane
- 2122 W Via Cipressi
- 5195 N Via Amore
- 2077 W Via Le Fontane
- 2140 W Via Le Fontane
- 2067 W Via Lante
- 5135 N Via Amore
- 2065 W Via Le Fontane
- 2054 W Via Le Fontane
- 2111 W Via Delfini
- 2139 W Via Le Fontane
- 2130 W Via Cipressi