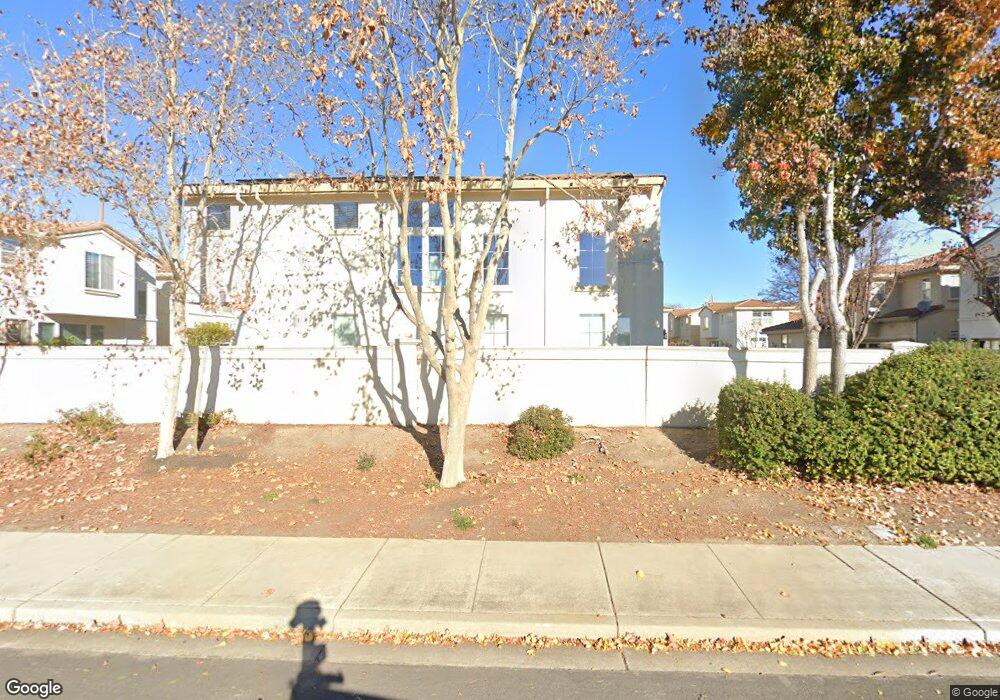
5169 San Viciente Loop Dublin, CA 94568
Estimated Value: $1,382,948 - $1,552,000
3
Beds
3
Baths
1,843
Sq Ft
$804/Sq Ft
Est. Value
About This Home
This home is located at 5169 San Viciente Loop, Dublin, CA 94568 and is currently estimated at $1,482,237, approximately $804 per square foot. 5169 San Viciente Loop is a home located in Alameda County with nearby schools including James Dougherty Elementary School, Dublin High School, and SPRINGFIELD MONTESSORI SCHOOL.
Ownership History
Date
Name
Owned For
Owner Type
Purchase Details
Closed on
Jan 13, 2016
Sold by
Yoo Byung S and Pil Seonah
Bought by
Yoo Byung S
Current Estimated Value
Purchase Details
Closed on
Oct 1, 2002
Sold by
Yoo Byung S and Pil Seonah
Bought by
Yoo Byung S and Pil Seonah
Home Financials for this Owner
Home Financials are based on the most recent Mortgage that was taken out on this home.
Original Mortgage
$420,000
Outstanding Balance
$176,210
Interest Rate
6.17%
Estimated Equity
$1,306,027
Purchase Details
Closed on
May 17, 2002
Sold by
Mission Peak Homes Inc
Bought by
Yoo Byung S and Yoo Phil Seonah
Home Financials for this Owner
Home Financials are based on the most recent Mortgage that was taken out on this home.
Original Mortgage
$420,000
Interest Rate
6.94%
Create a Home Valuation Report for This Property
The Home Valuation Report is an in-depth analysis detailing your home's value as well as a comparison with similar homes in the area
Purchase History
| Date | Buyer | Sale Price | Title Company |
|---|---|---|---|
| Yoo Byung S | -- | None Available | |
| Yoo Byung S | -- | First American Title Co | |
| Yoo Byung S | $525,000 | First American Title Guarant |
Source: Public Records
Mortgage History
| Date | Status | Borrower | Loan Amount |
|---|---|---|---|
| Open | Yoo Byung S | $420,000 | |
| Closed | Yoo Byung S | $420,000 |
Source: Public Records
Tax History
| Year | Tax Paid | Tax Assessment Tax Assessment Total Assessment is a certain percentage of the fair market value that is determined by local assessors to be the total taxable value of land and additions on the property. | Land | Improvement |
|---|---|---|---|---|
| 2025 | $10,699 | $775,530 | $232,659 | $542,871 |
| 2024 | $10,699 | $760,325 | $228,097 | $532,228 |
| 2023 | $10,584 | $745,420 | $223,626 | $521,794 |
| 2022 | $10,452 | $730,804 | $219,241 | $511,563 |
| 2021 | $10,354 | $716,477 | $214,943 | $501,534 |
| 2020 | $9,696 | $709,132 | $212,739 | $496,393 |
| 2019 | $9,667 | $695,230 | $208,569 | $486,661 |
| 2018 | $9,431 | $681,601 | $204,480 | $477,121 |
| 2017 | $9,296 | $668,240 | $200,472 | $467,768 |
| 2016 | $8,485 | $655,141 | $196,542 | $458,599 |
| 2015 | $8,189 | $645,303 | $193,591 | $451,712 |
| 2014 | $8,197 | $632,666 | $189,800 | $442,866 |
Source: Public Records
Map
Nearby Homes
- 4185 Font Ct
- 3989 Strafford Ct
- 4859 Swinford Ct Unit 402
- 4585 Brannigan St
- 4866 Shelton St
- 3744 Whitworth Dr Unit 93
- 4629 Sandyford Ct Unit 2206
- 3710 Central Pkwy Unit 165
- 3613 Whitworth Dr
- 3769 Finnian Way Unit 52
- 4612 Sandyford Ct Unit 1302
- 4730 Westwood Ct
- 4503 Sandyford Ct
- 4717 Chestnut Ct
- 4126 Clarinbridge Cir
- 4871 Redwood Ave
- 5919 Topsfield Cir
- 4480 Peacock Ct
- 3198 Vittoria Loop
- 5071 Winterbrook Ave
- 5179 San Viciente Loop
- 5159 San Viciente Loop
- 5130 San Viciente Terrace
- 5120 San Viciente Terrace
- 5140 San Viciente Terrace
- 5189 San Viciente Loop
- 4010 Ordaz Ct
- 5149 San Viciente Loop
- 5139 San Viciente Loop
- 5200 San Viciente Terrace
- 4013 Gallaup Ct
- 5129 San Viciente Loop
- 4009 Ordaz Ct
- 5199 San Viciente Loop
- 4008 Ordaz Ct
- 5210 San Viciente Terrace
- 4011 Gallaup Ct
- 4007 Ordaz Ct
- 4094 Cermanho Ct
- 4014 Gallaup Ct
Your Personal Tour Guide
Ask me questions while you tour the home.