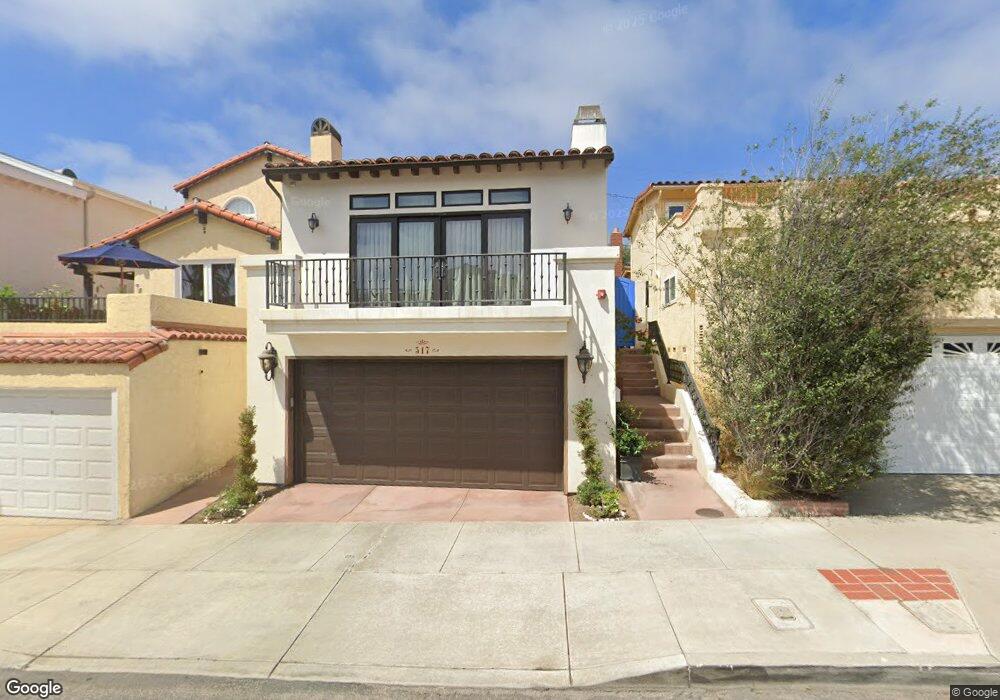
517 1st St Manhattan Beach, CA 90266
Estimated Value: $2,861,843 - $5,727,000
4
Beds
2
Baths
2,514
Sq Ft
$1,584/Sq Ft
Est. Value
About This Home
This home is located at 517 1st St, Manhattan Beach, CA 90266 and is currently estimated at $3,981,961, approximately $1,583 per square foot. 517 1st St is a home located in Los Angeles County with nearby schools including Opal Robinson Elementary School, Manhattan Beach Middle School, and Mira Costa High School.
Ownership History
Date
Name
Owned For
Owner Type
Purchase Details
Closed on
Jun 14, 2004
Sold by
Hawley John A and Hawley Louise G
Bought by
Peterman Brad and Peterman Misayo
Current Estimated Value
Home Financials for this Owner
Home Financials are based on the most recent Mortgage that was taken out on this home.
Original Mortgage
$1,000,000
Outstanding Balance
$476,336
Interest Rate
5.62%
Mortgage Type
New Conventional
Estimated Equity
$3,505,625
Purchase Details
Closed on
Dec 2, 1999
Sold by
Isaak John T and Isaak Kristine M
Bought by
Karen Ann Sarasalo Revocable Living Trus
Purchase Details
Closed on
Feb 7, 1995
Sold by
Citibank Fsb
Bought by
Isaak John T and Isaak Kristine M
Home Financials for this Owner
Home Financials are based on the most recent Mortgage that was taken out on this home.
Original Mortgage
$356,400
Interest Rate
8.5%
Purchase Details
Closed on
Dec 19, 1994
Sold by
Frank Richard and Citibank Fsb
Bought by
Citibank Fsb
Home Financials for this Owner
Home Financials are based on the most recent Mortgage that was taken out on this home.
Original Mortgage
$356,400
Interest Rate
8.5%
Create a Home Valuation Report for This Property
The Home Valuation Report is an in-depth analysis detailing your home's value as well as a comparison with similar homes in the area
Home Values in the Area
Average Home Value in this Area
Purchase History
| Date | Buyer | Sale Price | Title Company |
|---|---|---|---|
| Peterman Brad | $1,365,000 | Fidelity National Title Co L | |
| Karen Ann Sarasalo Revocable Living Trus | $890,000 | First American Title Co | |
| Isaak John T | $445,500 | First American Title Co | |
| Citibank Fsb | $400,000 | North American Title Company |
Source: Public Records
Mortgage History
| Date | Status | Borrower | Loan Amount |
|---|---|---|---|
| Open | Peterman Brad | $1,000,000 | |
| Previous Owner | Isaak John T | $356,400 | |
| Closed | Peterman Brad | $125,000 |
Source: Public Records
Tax History
| Year | Tax Paid | Tax Assessment Tax Assessment Total Assessment is a certain percentage of the fair market value that is determined by local assessors to be the total taxable value of land and additions on the property. | Land | Improvement |
|---|---|---|---|---|
| 2025 | $21,531 | $1,909,114 | $1,522,150 | $386,964 |
| 2024 | $21,531 | $1,871,681 | $1,492,304 | $379,377 |
| 2023 | $20,944 | $1,834,983 | $1,463,044 | $371,939 |
| 2022 | $20,582 | $1,799,004 | $1,434,357 | $364,647 |
| 2021 | $20,231 | $1,763,731 | $1,406,233 | $357,498 |
| 2019 | $19,688 | $1,711,420 | $1,364,524 | $346,896 |
| 2018 | $19,281 | $1,677,864 | $1,337,769 | $340,095 |
| 2017 | $18,698 | $1,644,966 | $1,311,539 | $333,427 |
| 2016 | $17,893 | $1,612,713 | $1,285,823 | $326,890 |
| 2015 | $17,522 | $1,588,489 | $1,266,509 | $321,980 |
| 2014 | $17,275 | $1,557,373 | $1,241,700 | $315,673 |
Source: Public Records
Map
Nearby Homes
- 436 1st St
- 98 Highland Ave
- 109 S Poinsettia Ave
- 215 S Poinsettia Ave
- 89 Bayview Dr
- 231 Longfellow Ave
- 121 35th St
- 626 Longfellow Ave
- 621 6th St
- 500 N Poinsettia Ave
- 2965 La Carlita St
- 921 Highland Ave
- 337 10th St
- 927 9th St
- 920 The Strand
- 649 Gould Terrace
- 1000 The Strand
- 124 11th St
- 710 Manhattan Beach Blvd
- 525 Manhattan Beach Blvd
Your Personal Tour Guide
Ask me questions while you tour the home.