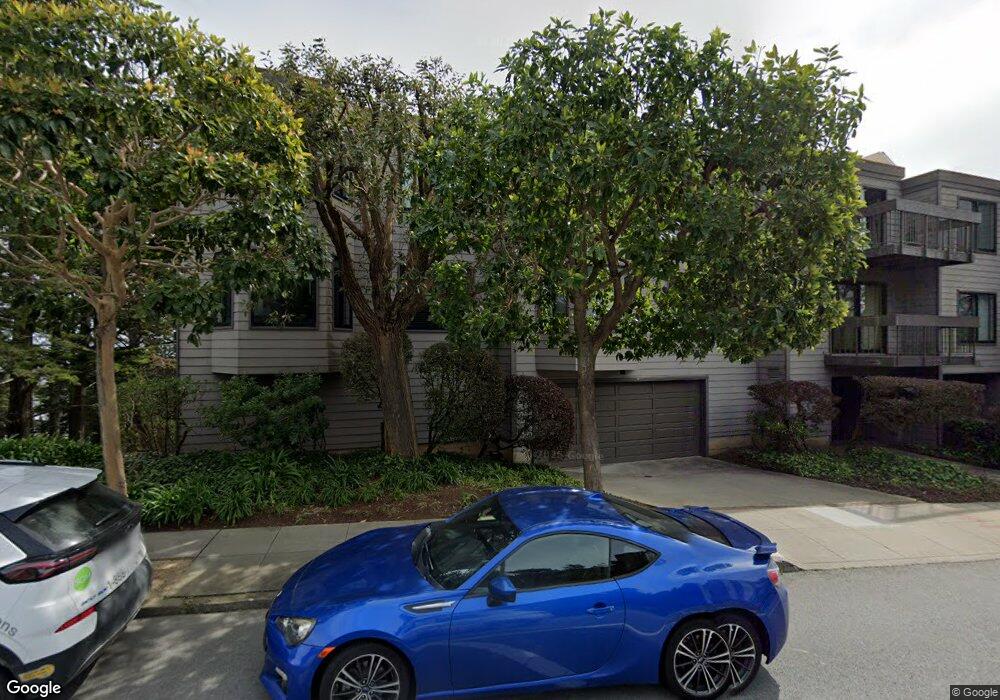
5173 Diamond Heights Blvd Unit 116 San Francisco, CA 94131
Noe Valley NeighborhoodEstimated Value: $869,000 - $971,844
2
Beds
2
Baths
1,273
Sq Ft
$718/Sq Ft
Est. Value
About This Home
This home is located at 5173 Diamond Heights Blvd Unit 116, San Francisco, CA 94131 and is currently estimated at $914,461, approximately $718 per square foot. 5173 Diamond Heights Blvd Unit 116 is a home located in San Francisco County with nearby schools including Alvarado Elementary, James Lick Middle School, and St. Philip School.
Ownership History
Date
Name
Owned For
Owner Type
Purchase Details
Closed on
Oct 15, 2020
Sold by
Minahan Daniel Patrick and Minahan Daniel P
Bought by
Minahan Daniel Patrick and Daniel Patrick Minahan Trust
Current Estimated Value
Purchase Details
Closed on
Nov 9, 1999
Sold by
Madhusudan Matta and Madhusudan Mandira C
Bought by
Minahan Daniel P
Home Financials for this Owner
Home Financials are based on the most recent Mortgage that was taken out on this home.
Original Mortgage
$236,800
Outstanding Balance
$57,001
Interest Rate
4.95%
Estimated Equity
$857,460
Purchase Details
Closed on
Aug 8, 1997
Sold by
Maichi Fong
Bought by
Matta Madhusudan and Matta Mandira C
Home Financials for this Owner
Home Financials are based on the most recent Mortgage that was taken out on this home.
Original Mortgage
$188,700
Interest Rate
7.87%
Create a Home Valuation Report for This Property
The Home Valuation Report is an in-depth analysis detailing your home's value as well as a comparison with similar homes in the area
Home Values in the Area
Average Home Value in this Area
Purchase History
| Date | Buyer | Sale Price | Title Company |
|---|---|---|---|
| Minahan Daniel Patrick | -- | None Available | |
| Minahan Daniel P | $296,000 | Fidelity National Title Co | |
| Matta Madhusudan | $210,000 | First American Title Co |
Source: Public Records
Mortgage History
| Date | Status | Borrower | Loan Amount |
|---|---|---|---|
| Open | Minahan Daniel P | $236,800 | |
| Previous Owner | Matta Madhusudan | $188,700 |
Source: Public Records
Tax History Compared to Growth
Tax History
| Year | Tax Paid | Tax Assessment Tax Assessment Total Assessment is a certain percentage of the fair market value that is determined by local assessors to be the total taxable value of land and additions on the property. | Land | Improvement |
|---|---|---|---|---|
| 2025 | $5,281 | $454,918 | $272,955 | $181,963 |
| 2024 | $5,281 | $445,999 | $267,603 | $178,396 |
| 2023 | $5,194 | $437,255 | $262,356 | $174,899 |
| 2022 | $5,099 | $428,682 | $257,212 | $171,470 |
| 2021 | $5,011 | $420,277 | $252,169 | $168,108 |
| 2020 | $5,026 | $415,969 | $249,584 | $166,385 |
| 2019 | $5,464 | $407,814 | $244,691 | $163,123 |
| 2018 | $5,281 | $399,819 | $239,894 | $159,925 |
| 2017 | $4,919 | $391,981 | $235,191 | $156,790 |
| 2016 | $4,815 | $384,296 | $230,580 | $153,716 |
| 2015 | $4,753 | $378,525 | $227,117 | $151,408 |
| 2014 | $4,628 | $371,112 | $222,669 | $148,443 |
Source: Public Records
Map
Nearby Homes
- 5140 Diamond Heights Blvd Unit 203A
- 5177 Diamond Heights Blvd Unit 113
- 5160 Diamond Heights Blvd Unit 107C
- 55 Red Rock Way Unit 207
- 175 Red Rock Way Unit 101K
- 175 Red Rock Way Unit K204
- 175 Red Rock Way Unit 303K
- 5004 Diamond Heights Blvd Unit 2
- 4335 Cesar Chavez St
- 724 27th St
- 29 Cameo Way Unit 1
- 49 High St
- 298 Portola Dr Unit 103
- 464 Hoffman Ave
- 447 Hoffman Ave
- 126 Gold Mine Dr
- 8 Fountain St
- 833 Douglass St
- 49 Turquoise Way
- 4258 26th St
- 5179 Diamond Heights Blvd
- 5173 Diamond Heights Blvd Unit 119
- 5173 Diamond Heights Blvd Unit 119
- 5179 Diamond Heights Blvd Unit 110
- 5173 Diamond Heights Blvd Unit 217
- 5173 Diamond Heights Blvd Unit 216
- 5179 Diamond Heights Blvd Unit 211
- 5179 Diamond Heights Blvd Unit 210
- 5173 Diamond Heights Blvd Unit 118
- 5173 Diamond Heights Blvd Unit 117
- 5179 Diamond Heights Blvd Unit 111
- 5177 Diamond Heights Blvd Unit 215
- 5177 Diamond Heights Blvd Unit 214
- 5177 Diamond Heights Blvd Unit 213
- 5177 Diamond Heights Blvd Unit 212
- 5177 Diamond Heights Blvd Unit 115
- 5177 Diamond Heights Blvd Unit 112
- 5175 Diamond Heights Blvd Unit 220
- 5175 Diamond Heights Blvd Unit 221
- 5175 Diamond Heights Blvd Unit 219