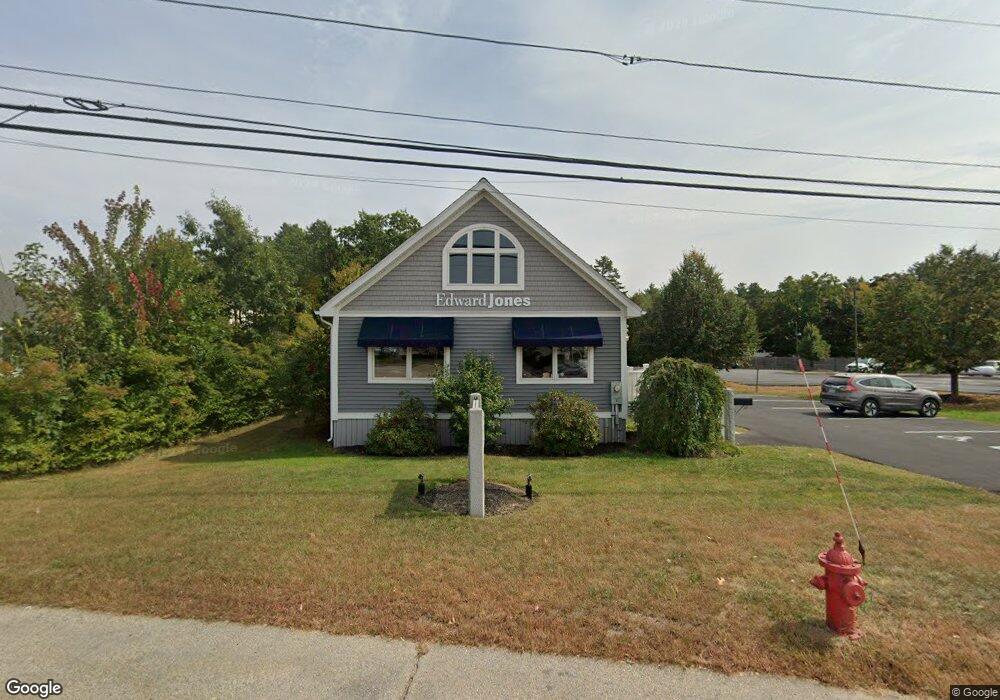
518 High St Somersworth, NH 03878
Estimated Value: $527,766
1
Bed
1
Bath
1,054
Sq Ft
$501/Sq Ft
Est. Value
About This Home
This home is located at 518 High St, Somersworth, NH 03878 and is currently estimated at $527,766, approximately $500 per square foot. 518 High St is a home located in Strafford County with nearby schools including Rollinsford Grade School, Seacoast Charter School, and Tri-City Christian Academy.
Ownership History
Date
Name
Owned For
Owner Type
Purchase Details
Closed on
Nov 20, 2023
Sold by
Bryjack Properties Llc
Bought by
P-Pod Re Holdings Llc
Current Estimated Value
Home Financials for this Owner
Home Financials are based on the most recent Mortgage that was taken out on this home.
Original Mortgage
$200,000
Outstanding Balance
$196,504
Interest Rate
7.49%
Mortgage Type
Purchase Money Mortgage
Estimated Equity
$331,262
Purchase Details
Closed on
Mar 13, 2015
Sold by
Settele Brian E
Bought by
Bryjack Properties Llc
Home Financials for this Owner
Home Financials are based on the most recent Mortgage that was taken out on this home.
Original Mortgage
$194,550
Interest Rate
3.67%
Mortgage Type
Commercial
Purchase Details
Closed on
Jun 22, 2011
Sold by
Sinclair Susan L and Fnma
Bought by
Fnma
Purchase Details
Closed on
Aug 23, 2007
Sold by
Gessis Muriel E Est and Gessis
Bought by
Sinclair Susan L
Home Financials for this Owner
Home Financials are based on the most recent Mortgage that was taken out on this home.
Original Mortgage
$204,250
Interest Rate
6.78%
Mortgage Type
Commercial
Create a Home Valuation Report for This Property
The Home Valuation Report is an in-depth analysis detailing your home's value as well as a comparison with similar homes in the area
Home Values in the Area
Average Home Value in this Area
Purchase History
| Date | Buyer | Sale Price | Title Company |
|---|---|---|---|
| P-Pod Re Holdings Llc | $450,000 | None Available | |
| P-Pod Re Holdings Llc | $450,000 | None Available | |
| Bryjack Properties Llc | $259,400 | -- | |
| Bryjack Properties Llc | $259,400 | -- | |
| Fnma | $176,700 | -- | |
| Fnma | $176,700 | -- | |
| Sinclair Susan L | $215,000 | -- | |
| Sinclair Susan L | $215,000 | -- |
Source: Public Records
Mortgage History
| Date | Status | Borrower | Loan Amount |
|---|---|---|---|
| Open | P-Pod Re Holdings Llc | $200,000 | |
| Closed | P-Pod Re Holdings Llc | $200,000 | |
| Previous Owner | Bryjack Properties Llc | $194,550 | |
| Previous Owner | Sinclair Susan L | $204,250 |
Source: Public Records
Tax History Compared to Growth
Tax History
| Year | Tax Paid | Tax Assessment Tax Assessment Total Assessment is a certain percentage of the fair market value that is determined by local assessors to be the total taxable value of land and additions on the property. | Land | Improvement |
|---|---|---|---|---|
| 2024 | $6,880 | $367,900 | $150,900 | $217,000 |
| 2023 | $6,493 | $221,600 | $95,000 | $126,600 |
| 2022 | $5,961 | $212,200 | $95,000 | $117,200 |
| 2021 | $5,842 | $212,200 | $95,000 | $117,200 |
| 2020 | $5,910 | $212,200 | $95,000 | $117,200 |
| 2019 | $5,789 | $212,200 | $95,000 | $117,200 |
| 2018 | $8,155 | $244,100 | $137,700 | $106,400 |
| 2017 | $8,077 | $244,100 | $137,700 | $106,400 |
| 2016 | $7,840 | $244,100 | $137,700 | $106,400 |
| 2015 | $7,872 | $244,100 | $137,700 | $106,400 |
| 2014 | $7,601 | $244,100 | $137,700 | $106,400 |
Source: Public Records
Map
Nearby Homes
- 13 Sullivan Dr
- 0 Indian Brook Rd
- 15 Evergreen Valley Dr
- 4 Barry St
- 815 Central Ave
- 80 Glenwood Ave
- 3 Dudley Ct
- 14 Dudley Ct
- 725 Central Ave Unit 203
- 725 Central Ave Unit LL03
- 725 Central Ave Unit 301
- 725 Central Ave Unit 302
- 725 Central Ave Unit LL01
- 725 Central Ave Unit 304
- 92 Old Rochester Rd
- 713 Central Ave Unit 1
- 34 Floral Ave Unit 5
- 36 Oak St
- 301 Sherwood Glen
- 200 Sherwood Glen