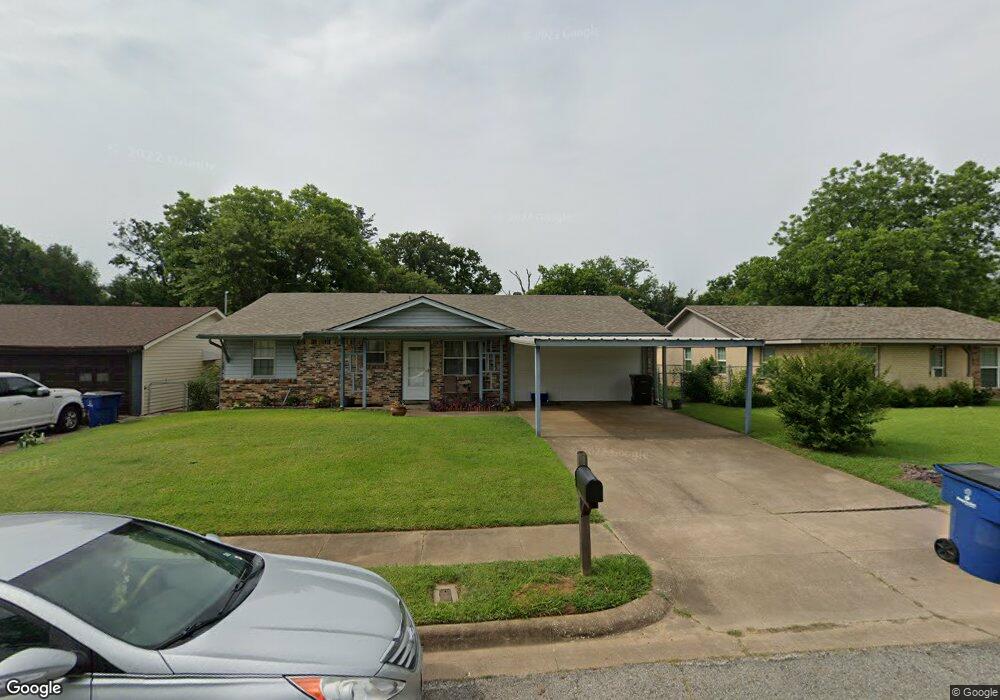
518 Joy Ln Denison, TX 75021
Estimated Value: $182,354 - $215,000
3
Beds
2
Baths
1,318
Sq Ft
$151/Sq Ft
Est. Value
About This Home
This home is located at 518 Joy Ln, Denison, TX 75021 and is currently estimated at $198,677, approximately $150 per square foot. 518 Joy Ln is a home located in Grayson County with nearby schools including Scott Middle School, Denison High School, and St. Luke's Parish Day School.
Ownership History
Date
Name
Owned For
Owner Type
Purchase Details
Closed on
Apr 29, 2016
Sold by
Tyndell Danny J and Weaver Pamela A
Bought by
Watherwax Marolyn
Current Estimated Value
Home Financials for this Owner
Home Financials are based on the most recent Mortgage that was taken out on this home.
Original Mortgage
$78,000
Outstanding Balance
$62,194
Interest Rate
3.71%
Mortgage Type
New Conventional
Estimated Equity
$136,483
Purchase Details
Closed on
Jul 16, 2008
Sold by
Tyndell Joe T
Bought by
Weaver Pamela A and Tyndell Danny J
Create a Home Valuation Report for This Property
The Home Valuation Report is an in-depth analysis detailing your home's value as well as a comparison with similar homes in the area
Home Values in the Area
Average Home Value in this Area
Purchase History
| Date | Buyer | Sale Price | Title Company |
|---|---|---|---|
| Watherwax Marolyn | -- | Chapin Title Co Inc | |
| Weaver Pamela A | -- | None Available |
Source: Public Records
Mortgage History
| Date | Status | Borrower | Loan Amount |
|---|---|---|---|
| Open | Watherwax Marolyn | $78,000 |
Source: Public Records
Tax History
| Year | Tax Paid | Tax Assessment Tax Assessment Total Assessment is a certain percentage of the fair market value that is determined by local assessors to be the total taxable value of land and additions on the property. | Land | Improvement |
|---|---|---|---|---|
| 2025 | $2,285 | $158,011 | $39,460 | $118,551 |
| 2024 | $3,538 | $152,275 | $33,999 | $118,276 |
| 2023 | $2,041 | $145,311 | $33,999 | $111,312 |
| 2022 | $3,302 | $138,981 | $33,999 | $104,982 |
| 2021 | $3,221 | $127,695 | $16,647 | $111,048 |
| 2020 | $3,078 | $116,700 | $16,647 | $100,053 |
| 2019 | $3,126 | $117,397 | $11,098 | $106,299 |
| 2018 | $2,865 | $104,923 | $11,098 | $93,825 |
| 2017 | $2,626 | $93,874 | $11,098 | $82,776 |
| 2016 | $2,277 | $81,381 | $11,098 | $70,283 |
| 2015 | $2,004 | $70,954 | $6,606 | $64,348 |
| 2014 | $1,959 | $69,355 | $6,606 | $62,749 |
Source: Public Records
Map
Nearby Homes
- 513 Joy Ln
- 516 Forrest Ln
- 227 Sheryl Ln
- 40 Sheryl Ln
- 905 Seymore Cir
- 2931 S Barrett Ave
- 3101 S College Blvd
- 711 Dubois St
- 618 Star St
- 905 Thatcher St
- 907 Thatcher St
- 901 Dubois St
- 701 W Star St
- 603 W Star St
- 3312 Vine Ln
- 2526 S Fannin Ave Unit 2600
- 501 W Collins St
- 614 Rice St
- 916 W Collins St
- 929 W Collins St
Your Personal Tour Guide
Ask me questions while you tour the home.