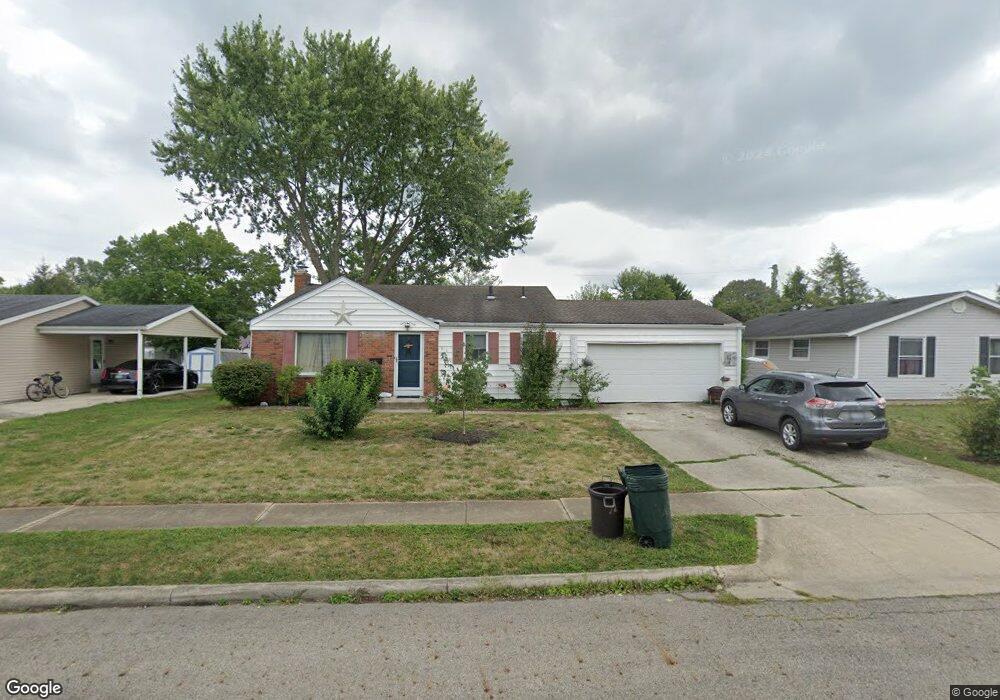
518 Mowrer Rd Circleville, OH 43113
Estimated Value: $235,770 - $271,000
3
Beds
2
Baths
1,508
Sq Ft
$167/Sq Ft
Est. Value
About This Home
This home is located at 518 Mowrer Rd, Circleville, OH 43113 and is currently estimated at $252,193, approximately $167 per square foot. 518 Mowrer Rd is a home located in Pickaway County with nearby schools including Circleville High School and New Hope Christian Academy.
Ownership History
Date
Name
Owned For
Owner Type
Purchase Details
Closed on
Jan 24, 2020
Sold by
Dolby Shelly and Dolby Robert
Bought by
Dolby Robert
Current Estimated Value
Purchase Details
Closed on
Nov 4, 2005
Sold by
Potter Christopher
Bought by
Dolby Robert S and Dolby Shelly J
Home Financials for this Owner
Home Financials are based on the most recent Mortgage that was taken out on this home.
Original Mortgage
$128,000
Outstanding Balance
$67,382
Interest Rate
5.89%
Mortgage Type
Fannie Mae Freddie Mac
Estimated Equity
$184,811
Purchase Details
Closed on
Aug 22, 2005
Sold by
Hud
Bought by
Potter Christopher
Home Financials for this Owner
Home Financials are based on the most recent Mortgage that was taken out on this home.
Original Mortgage
$77,200
Interest Rate
5.89%
Mortgage Type
Fannie Mae Freddie Mac
Purchase Details
Closed on
Apr 27, 2005
Sold by
Murray Angila S
Bought by
Hud
Create a Home Valuation Report for This Property
The Home Valuation Report is an in-depth analysis detailing your home's value as well as a comparison with similar homes in the area
Home Values in the Area
Average Home Value in this Area
Purchase History
| Date | Buyer | Sale Price | Title Company |
|---|---|---|---|
| Dolby Robert | -- | None Available | |
| Dolby Robert S | $128,000 | Fairfield Title & Closing Se | |
| Potter Christopher | $96,500 | Contract Processing & Title | |
| Hud | $73,334 | None Available |
Source: Public Records
Mortgage History
| Date | Status | Borrower | Loan Amount |
|---|---|---|---|
| Open | Dolby Robert S | $128,000 | |
| Closed | Potter Christopher | $77,200 |
Source: Public Records
Tax History
| Year | Tax Paid | Tax Assessment Tax Assessment Total Assessment is a certain percentage of the fair market value that is determined by local assessors to be the total taxable value of land and additions on the property. | Land | Improvement |
|---|---|---|---|---|
| 2025 | $4,364 | $57,620 | $10,960 | $46,660 |
| 2024 | $4,364 | $57,620 | $10,960 | $46,660 |
| 2023 | $2,020 | $57,620 | $10,960 | $46,660 |
| 2022 | $1,888 | $42,770 | $9,170 | $33,600 |
| 2021 | $1,900 | $42,770 | $9,170 | $33,600 |
| 2020 | $1,899 | $42,770 | $9,170 | $33,600 |
| 2019 | $1,848 | $38,000 | $9,170 | $28,830 |
| 2018 | $1,854 | $38,000 | $9,170 | $28,830 |
| 2017 | $3,015 | $38,000 | $9,170 | $28,830 |
| 2016 | $1,868 | $38,010 | $9,630 | $28,380 |
| 2015 | $1,870 | $38,010 | $9,630 | $28,380 |
| 2014 | $1,863 | $38,010 | $9,630 | $28,380 |
| 2013 | $1,963 | $39,430 | $9,630 | $29,800 |
Source: Public Records
Map
Nearby Homes
- 255 Lewis Rd
- 1214 Dunhurst St
- 1205 Dunhurst St Unit 12051
- 542 Douglas Dr
- 1242 Dunhurst St
- 1235 Dunhurst St
- 1252 Dunhurst St
- 0 Morris Rd
- 1543 Georgia Rd
- 1539 Georgia Rd
- 892 N Court St
- 339 Meadow Ln
- 1545 Shagbark St
- 1556 Georgia Rd
- 1540 Shagbark St
- 445 Victor Dr
- 300 Wedgewood Ct
- 364 Victor Dr
- 352 Victor Dr
- 114 Evergreen Ave
- 512 Mowrer Rd
- 524 Mowrer Rd
- 530 Mowrer Rd
- 416 Cedar Heights
- 412 Cedar Heights Rd
- 489 Edwards Rd
- 412 Cedar Heights
- 517 Mowrer Rd
- 523 Mowrer Rd
- 420 Cedar Heights
- 402 Cedar Heights
- 529 Mowrer Rd
- 536 Mowrer Rd
- 420 Cedar Heights Rd
- 495 Edwards Rd
- 483 Edwards Rd
- 535 Mowrer Rd
- 413 Cedar Heights
- 424 Cedar Heights
- 542 Mowrer Rd
Your Personal Tour Guide
Ask me questions while you tour the home.