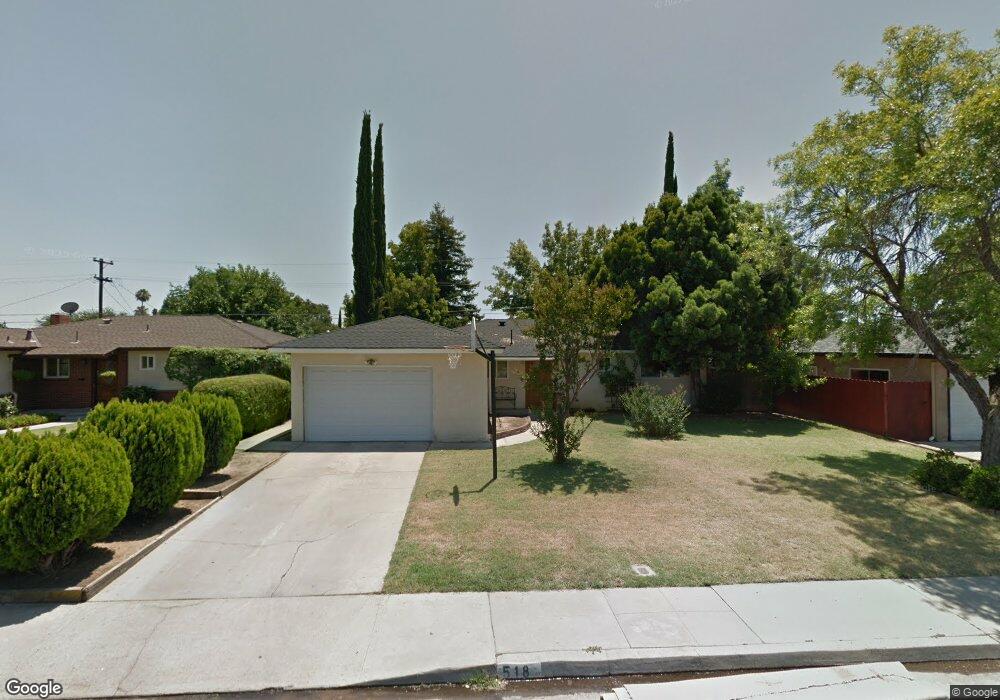
518 W Dennis Dr Clovis, CA 93612
Estimated Value: $326,000 - $404,000
3
Beds
2
Baths
1,075
Sq Ft
$331/Sq Ft
Est. Value
About This Home
This home is located at 518 W Dennis Dr, Clovis, CA 93612 and is currently estimated at $356,087, approximately $331 per square foot. 518 W Dennis Dr is a home located in Fresno County with nearby schools including Sierra Vista Elementary School, Clark Intermediate School, and Clovis High School.
Ownership History
Date
Name
Owned For
Owner Type
Purchase Details
Closed on
Nov 5, 2008
Sold by
Hsbc Baank Usa National Association
Bought by
Villegas Cristina
Current Estimated Value
Home Financials for this Owner
Home Financials are based on the most recent Mortgage that was taken out on this home.
Original Mortgage
$145,085
Outstanding Balance
$96,592
Interest Rate
6.37%
Mortgage Type
FHA
Estimated Equity
$259,495
Purchase Details
Closed on
Mar 26, 2008
Sold by
Alfaro Fernando and Alfaro Delia
Bought by
Fremont Investment & Loan
Purchase Details
Closed on
Oct 11, 2005
Sold by
Esquibel Albert M
Bought by
Alfaro Fernando and Alfaro Delia
Home Financials for this Owner
Home Financials are based on the most recent Mortgage that was taken out on this home.
Original Mortgage
$60,000
Interest Rate
5.93%
Mortgage Type
Stand Alone Second
Purchase Details
Closed on
Apr 19, 2002
Sold by
Esquibel Jennie and Esquibel Albert M
Bought by
Esquibel Albert M
Create a Home Valuation Report for This Property
The Home Valuation Report is an in-depth analysis detailing your home's value as well as a comparison with similar homes in the area
Home Values in the Area
Average Home Value in this Area
Purchase History
| Date | Buyer | Sale Price | Title Company |
|---|---|---|---|
| Villegas Cristina | $147,000 | Lawyers Title Company | |
| Fremont Investment & Loan | $168,000 | First American Title Company | |
| Alfaro Fernando | $300,000 | Alliance Title Company | |
| Esquibel Albert M | -- | Alliance Title Company | |
| Esquibel Albert M | -- | -- |
Source: Public Records
Mortgage History
| Date | Status | Borrower | Loan Amount |
|---|---|---|---|
| Open | Villegas Cristina | $145,085 | |
| Previous Owner | Esquibel Albert M | $60,000 | |
| Previous Owner | Alfaro Fernando | $240,000 |
Source: Public Records
Tax History
| Year | Tax Paid | Tax Assessment Tax Assessment Total Assessment is a certain percentage of the fair market value that is determined by local assessors to be the total taxable value of land and additions on the property. | Land | Improvement |
|---|---|---|---|---|
| 2025 | $2,171 | $189,287 | $77,259 | $112,028 |
| 2023 | $2,086 | $181,939 | $74,260 | $107,679 |
| 2022 | $2,057 | $178,372 | $72,804 | $105,568 |
| 2021 | $1,998 | $174,876 | $71,377 | $103,499 |
| 2020 | $1,990 | $173,084 | $70,646 | $102,438 |
| 2019 | $1,950 | $169,691 | $69,261 | $100,430 |
| 2018 | $1,906 | $166,364 | $67,903 | $98,461 |
| 2017 | $1,835 | $160,000 | $45,000 | $115,000 |
| 2016 | $1,692 | $150,000 | $45,000 | $105,000 |
| 2015 | $1,795 | $151,900 | $62,000 | $89,900 |
| 2014 | $1,685 | $142,300 | $58,100 | $84,200 |
Source: Public Records
Map
Nearby Homes
- 487 W San Jose Ave
- 1335 Cindy Ave
- 1314 Terry Ave
- 647 W Dennis Dr
- 1500 Villa Ave Unit 107
- 1500 Villa Ave Unit 27
- 1500 Villa Ave Unit spc 7
- 1272 Villa Ave Unit 69
- 1272 Villa Ave Unit 76
- 1272 Villa Ave Unit SPC92
- 1272 Villa Ave Unit 66
- 3600 W Shaw Ave
- 1629 Willow Ave
- 1650 Villa Ave Unit 48
- 1650 Villa Ave Unit 9
- 1063 Pierce Dr
- 2110 Helm Ave Unit 19
- 1416 Plymouth Rock Way
- 1448 Plymouth Rock Way
- 1001 Sylmar Ave Unit 216
- 508 W Dennis Dr
- 528 W Dennis Dr
- 507 W Beverly Dr
- 527 W Beverly Dr
- 498 W Dennis Dr
- 497 W Beverly Dr
- 517 W Dennis Dr
- 507 W Dennis Dr
- 527 W Dennis Dr
- 488 W Dennis Dr
- 497 W Dennis Dr
- 487 W Beverly Dr
- 547 W Beverly Dr
- 547 W Dennis Dr
- 487 W Dennis Dr
- 558 W Dennis Dr
- 478 W Dennis Dr
- 518 W Beverly Dr
- 508 W Beverly Dr
- 528 W Beverly Dr
Your Personal Tour Guide
Ask me questions while you tour the home.