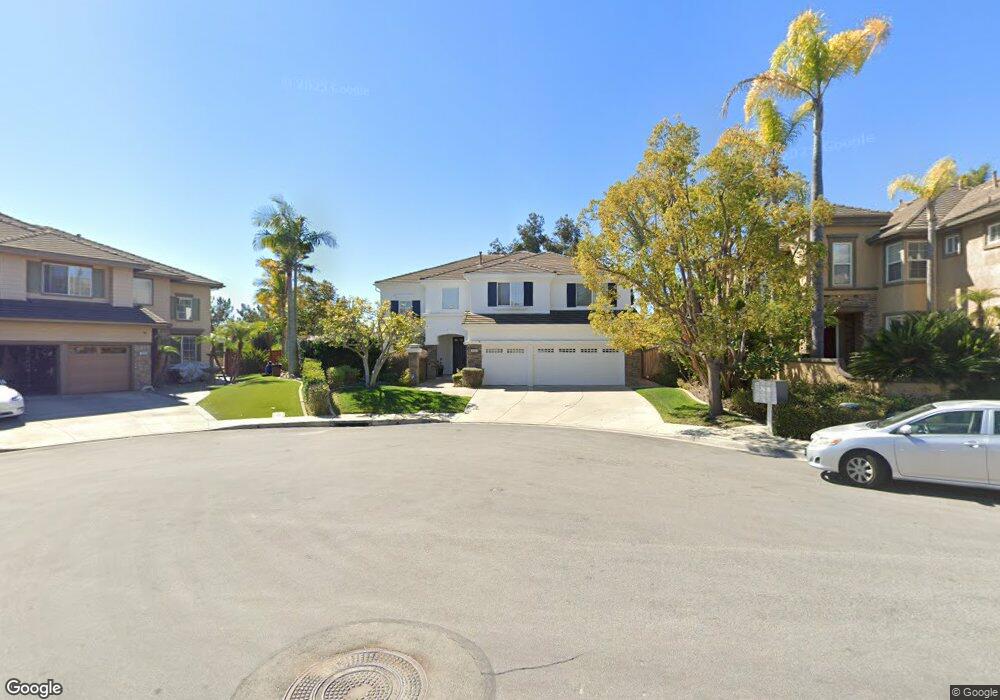
5185 Seashell Place San Diego, CA 92130
Carmel Valley NeighborhoodEstimated Value: $2,769,455 - $3,133,000
5
Beds
6
Baths
3,779
Sq Ft
$783/Sq Ft
Est. Value
About This Home
This home is located at 5185 Seashell Place, San Diego, CA 92130 and is currently estimated at $2,957,114, approximately $782 per square foot. 5185 Seashell Place is a home located in San Diego County with nearby schools including Ashley Falls Elementary School, Pacific Trails Middle, and Torrey Pines High School.
Ownership History
Date
Name
Owned For
Owner Type
Purchase Details
Closed on
Dec 3, 2012
Sold by
Levinson Gary D and Levinson Jodi
Bought by
Levinson Gary D and Levinson Jodi
Current Estimated Value
Home Financials for this Owner
Home Financials are based on the most recent Mortgage that was taken out on this home.
Original Mortgage
$545,250
Interest Rate
3.36%
Mortgage Type
New Conventional
Purchase Details
Closed on
Jul 29, 2010
Sold by
Levinson Gary D and Levinson Jodi
Bought by
Levinson Gary D and Levinson Jodi
Home Financials for this Owner
Home Financials are based on the most recent Mortgage that was taken out on this home.
Original Mortgage
$603,700
Interest Rate
4.52%
Mortgage Type
New Conventional
Purchase Details
Closed on
Nov 5, 2009
Sold by
Levinson Gary D and Levinson Jodi
Bought by
Levinson Gary D and Levinson Jodi
Home Financials for this Owner
Home Financials are based on the most recent Mortgage that was taken out on this home.
Original Mortgage
$606,300
Interest Rate
4.92%
Mortgage Type
New Conventional
Purchase Details
Closed on
Apr 14, 2003
Sold by
Levinson Gary D and Levinson Jodi
Bought by
Levinson Gary D and Levinson Jodi
Home Financials for this Owner
Home Financials are based on the most recent Mortgage that was taken out on this home.
Original Mortgage
$390,000
Interest Rate
5.54%
Purchase Details
Closed on
Oct 29, 2002
Sold by
Levinson Gary D and Levinson Jodi
Bought by
Levinson Gary D and Levinson Jodi
Home Financials for this Owner
Home Financials are based on the most recent Mortgage that was taken out on this home.
Original Mortgage
$400,000
Interest Rate
5.88%
Purchase Details
Closed on
Oct 12, 1998
Sold by
Levinson Gary D and Levinson Jodi
Bought by
Levinson Gary D and Levinson Jodi
Purchase Details
Closed on
Jun 24, 1998
Sold by
Standard Pacific Corp
Bought by
Levinson Gary D and Levinson Jodi
Home Financials for this Owner
Home Financials are based on the most recent Mortgage that was taken out on this home.
Original Mortgage
$452,800
Interest Rate
6.88%
Create a Home Valuation Report for This Property
The Home Valuation Report is an in-depth analysis detailing your home's value as well as a comparison with similar homes in the area
Home Values in the Area
Average Home Value in this Area
Purchase History
| Date | Buyer | Sale Price | Title Company |
|---|---|---|---|
| Levinson Gary D | -- | Accommodation | |
| Levinson Gary D | -- | Lawyers Title Company | |
| Levinson Gary D | -- | Fidelity National Title Co | |
| Levinson Gary D | -- | Fidelity National Title Co | |
| Levinson Gary D | -- | Fidelity Title Company | |
| Levinson Gary D | -- | None Available | |
| Levinson Gary D | -- | Stewart Title Of Ca Inc | |
| Levinson Gary D | -- | Stewart Title Of Ca Inc | |
| Levinson Gary D | -- | Stewart Title | |
| Levinson Gary D | -- | First American Title Ins Co | |
| Levinson Gary D | $566,000 | First American Title |
Source: Public Records
Mortgage History
| Date | Status | Borrower | Loan Amount |
|---|---|---|---|
| Previous Owner | Levinson Gary D | $545,250 | |
| Previous Owner | Levinson Gary D | $603,700 | |
| Previous Owner | Levinson Gary D | $606,300 | |
| Previous Owner | Levinson Gary D | $390,000 | |
| Previous Owner | Levinson Gary D | $400,000 | |
| Previous Owner | Levinson Gary D | $452,800 |
Source: Public Records
Tax History Compared to Growth
Tax History
| Year | Tax Paid | Tax Assessment Tax Assessment Total Assessment is a certain percentage of the fair market value that is determined by local assessors to be the total taxable value of land and additions on the property. | Land | Improvement |
|---|---|---|---|---|
| 2025 | $10,962 | $926,502 | $360,565 | $565,937 |
| 2024 | $10,962 | $908,337 | $353,496 | $554,841 |
| 2023 | $10,910 | $890,527 | $346,565 | $543,962 |
| 2022 | $10,739 | $873,067 | $339,770 | $533,297 |
| 2021 | $10,395 | $855,949 | $333,108 | $522,841 |
| 2020 | $10,473 | $847,173 | $329,693 | $517,480 |
| 2019 | $10,294 | $830,563 | $323,229 | $507,334 |
| 2018 | $9,902 | $814,279 | $316,892 | $497,387 |
| 2017 | $82 | $798,314 | $310,679 | $487,635 |
| 2016 | $9,466 | $782,662 | $304,588 | $478,074 |
| 2015 | $9,345 | $770,906 | $300,013 | $470,893 |
| 2014 | $9,181 | $755,806 | $294,137 | $461,669 |
Source: Public Records
Map
Nearby Homes
- 4970 Beauchamp Ct
- 4919 Concannon Ct
- 12722 Sandy Crest Ct
- 5091 Ruette de Mer
- 13120 Chambord Way
- 5480 Valerio Trail
- 5582 Valerio Trail
- 4436 Heritage Glen Ln
- 4271 Corte Favor
- 5621 Shasta Daisy Trail
- 12436 Cavallo St
- 5171 Del Mar Mesa Rd
- 5312 Sweetwater Trail
- 5146 Rancho Verde Trail
- 0 Grand Del Mar Place Unit VU 8-4-5 NDP2502279
- 13016 Lumen Way
- 12936 Carmel Creek Rd Unit 63
- 5347 Morning Sage Way
- 4695 Rancho Verde Trail
- 4945 Rancho Verde Trail
- 5171 Seashell Place
- 5199 Seashell Place
- 5142 Pearlman Way
- 5157 Seashell Place
- 5198 Seashell Place
- 5188 Seashell Place
- 5184 Seashell Place
- 5134 Pearlman Way
- 5170 Seashell Place
- 5143 Seashell Place
- 5183 Pearlman Way
- 5175 Pearlman Way
- 12892 Baywind Point
- 5156 Seashell Place
- 5163 Pearlman Way
- 5124 Pearlman Way
- 5151 Pearlman Way
- 5129 Seashell Place
- 5142 Seashell Place
- 12884 Baywind Point