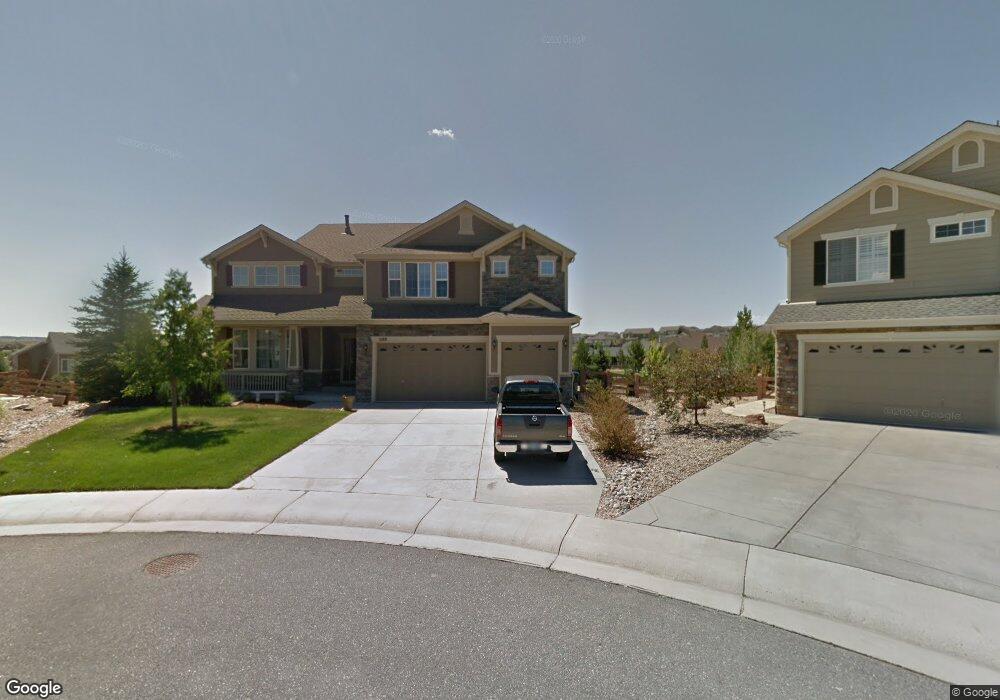
5189 Denim Ct Parker, CO 80134
The Pinery NeighborhoodEstimated Value: $1,118,000 - $1,173,000
5
Beds
6
Baths
6,455
Sq Ft
$177/Sq Ft
Est. Value
About This Home
This home is located at 5189 Denim Ct, Parker, CO 80134 and is currently estimated at $1,142,687, approximately $177 per square foot. 5189 Denim Ct is a home located in Douglas County with nearby schools including Mountain View Elementary School, Northeast Elementary School, and Sagewood Middle School.
Ownership History
Date
Name
Owned For
Owner Type
Purchase Details
Closed on
Sep 19, 2014
Sold by
Bender Joel M and Bender Michelle A
Bought by
Deroeck Cherylanne M and Deroeck Gregory J
Current Estimated Value
Home Financials for this Owner
Home Financials are based on the most recent Mortgage that was taken out on this home.
Original Mortgage
$478,000
Outstanding Balance
$365,940
Interest Rate
4.14%
Mortgage Type
New Conventional
Estimated Equity
$776,747
Purchase Details
Closed on
Jun 27, 2012
Sold by
Manherz John K and Manherz Robin A
Bought by
Bender Joel M and Bender Michelle A
Purchase Details
Closed on
Jun 30, 2004
Sold by
Kdb Homes Inc
Bought by
Manherz John K and Manherz Robin A
Home Financials for this Owner
Home Financials are based on the most recent Mortgage that was taken out on this home.
Original Mortgage
$404,950
Interest Rate
6.3%
Mortgage Type
Unknown
Create a Home Valuation Report for This Property
The Home Valuation Report is an in-depth analysis detailing your home's value as well as a comparison with similar homes in the area
Home Values in the Area
Average Home Value in this Area
Purchase History
| Date | Buyer | Sale Price | Title Company |
|---|---|---|---|
| Deroeck Cherylanne M | $597,500 | Fitco | |
| Bender Joel M | $433,500 | None Available | |
| Manherz John K | $506,225 | Fahtco |
Source: Public Records
Mortgage History
| Date | Status | Borrower | Loan Amount |
|---|---|---|---|
| Open | Deroeck Cherylanne M | $478,000 | |
| Previous Owner | Manherz John K | $404,950 |
Source: Public Records
Tax History Compared to Growth
Tax History
| Year | Tax Paid | Tax Assessment Tax Assessment Total Assessment is a certain percentage of the fair market value that is determined by local assessors to be the total taxable value of land and additions on the property. | Land | Improvement |
|---|---|---|---|---|
| 2024 | $8,933 | $76,260 | $12,990 | $63,270 |
| 2023 | $9,145 | $76,260 | $12,990 | $63,270 |
| 2022 | $7,355 | $53,210 | $8,270 | $44,940 |
| 2021 | $7,410 | $53,210 | $8,270 | $44,940 |
| 2020 | $6,854 | $50,470 | $8,810 | $41,660 |
| 2019 | $6,874 | $50,470 | $8,810 | $41,660 |
| 2018 | $6,670 | $48,490 | $8,510 | $39,980 |
| 2017 | $6,367 | $48,490 | $8,510 | $39,980 |
| 2016 | $6,255 | $46,120 | $5,970 | $40,150 |
| 2015 | $6,571 | $46,120 | $5,970 | $40,150 |
| 2014 | $5,795 | $39,030 | $4,380 | $34,650 |
Source: Public Records
Map
Nearby Homes
- 6017 Merchant Place
- 6078 Bridle Path Ln
- 5349 Rustler Trail
- 5453 Military Trail
- 5736 Cadara Way
- 5672 Vistancia Ct
- 6490 Coldwater Dr
- 5334 Sedona Dr
- 5625 Twilight Way
- 5657 Pinto Valley St
- 6228 Dapplegray St
- 8172 El Jebel Loop
- 6083 Saddle Bow Ave
- 6555 San Miguel Ct
- 6340 Verve Ln
- 7937 Grady Cir
- 6327 Verve Ln
- Wegner Plan at Toll Brothers at Cherry Creek Trail
- Breuer Plan at Toll Brothers at Cherry Creek Trail
- Jacobsen Plan at Toll Brothers at Cherry Creek Trail
- 5190 Denim Ct
- 5193 Denim Ct
- 5125 Streambed Trail
- 5139 Streambed Trail
- 5194 Denim Ct
- 5199 Denim Ct
- 5155 Streambed Trail
- 5200 Denim Ct
- 5171 Streambed Trail
- 5208 Denim Ct
- 5152 Mining Camp Trail
- 6000 Merchant Place
- 5132 Mining Camp Trail
- 5226 Mining Camp Trail
- 5187 Streambed Trail
- 5905 Lasso Place
- 5955 Lasso Place
- 5919 Lasso Place
- 5935 Lasso Place
- 6001 Merchant Place