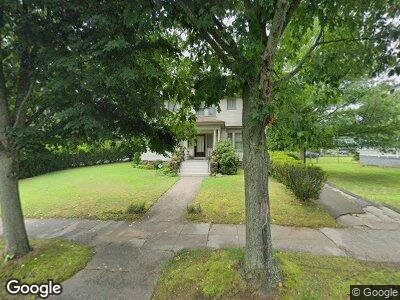
519 Edgewood Ave New Haven, CT 06511
Edgewood NeighborhoodEstimated Value: $627,000 - $769,000
5
Beds
4
Baths
3,697
Sq Ft
$192/Sq Ft
Est. Value
About This Home
This home is located at 519 Edgewood Ave, New Haven, CT 06511 and is currently estimated at $709,205, approximately $191 per square foot. 519 Edgewood Ave is a home located in New Haven County with nearby schools including Amistad Academy and Yeshiva Gedolah Rabbinical Inst.
Ownership History
Date
Name
Owned For
Owner Type
Purchase Details
Closed on
Sep 27, 2004
Sold by
Flood Scott and Aguilar Pamela
Bought by
Roper Jonathan A and Freezo Linda S
Current Estimated Value
Home Financials for this Owner
Home Financials are based on the most recent Mortgage that was taken out on this home.
Original Mortgage
$250,000
Outstanding Balance
$108,965
Interest Rate
3.87%
Purchase Details
Closed on
Dec 4, 2003
Sold by
Silcott Jennifer and Silcott Brian
Bought by
Flood Scorr and Aquilar Pamesco
Home Financials for this Owner
Home Financials are based on the most recent Mortgage that was taken out on this home.
Original Mortgage
$285,000
Interest Rate
6.03%
Purchase Details
Closed on
Oct 2, 2001
Sold by
Buczynsky-Dady Alice
Bought by
Silcott Brian and Silcott Jennifer
Home Financials for this Owner
Home Financials are based on the most recent Mortgage that was taken out on this home.
Original Mortgage
$148,500
Interest Rate
6.91%
Create a Home Valuation Report for This Property
The Home Valuation Report is an in-depth analysis detailing your home's value as well as a comparison with similar homes in the area
Home Values in the Area
Average Home Value in this Area
Purchase History
| Date | Buyer | Sale Price | Title Company |
|---|---|---|---|
| Roper Jonathan A | $355,000 | -- | |
| Flood Scorr | $285,000 | -- | |
| Silcott Brian | $156,350 | -- |
Source: Public Records
Mortgage History
| Date | Status | Borrower | Loan Amount |
|---|---|---|---|
| Open | Silcott Brian | $80,000 | |
| Open | Silcott Brian | $250,000 | |
| Previous Owner | Silcott Brian | $285,000 | |
| Previous Owner | Silcott Brian | $148,500 |
Source: Public Records
Tax History Compared to Growth
Tax History
| Year | Tax Paid | Tax Assessment Tax Assessment Total Assessment is a certain percentage of the fair market value that is determined by local assessors to be the total taxable value of land and additions on the property. | Land | Improvement |
|---|---|---|---|---|
| 2024 | $11,254 | $292,320 | $51,800 | $240,520 |
| 2023 | $10,874 | $292,320 | $51,800 | $240,520 |
| 2022 | $11,620 | $292,320 | $51,800 | $240,520 |
| 2021 | $10,342 | $235,690 | $44,590 | $191,100 |
| 2020 | $10,342 | $235,690 | $44,590 | $191,100 |
| 2019 | $10,130 | $235,690 | $44,590 | $191,100 |
| 2018 | $10,130 | $235,690 | $44,590 | $191,100 |
| 2017 | $9,116 | $235,690 | $44,590 | $191,100 |
| 2016 | $9,086 | $218,680 | $35,070 | $183,610 |
| 2015 | $9,086 | $218,680 | $35,070 | $183,610 |
| 2014 | $9,086 | $218,680 | $35,070 | $183,610 |
Source: Public Records
Map
Nearby Homes
- 25 W Park Ave
- 890 Elm St
- 179 Maple St
- 868 Elm St
- 865 Elm St
- 1309 Ella T Grasso Blvd
- 96 Hubinger St
- 187 W Park Ave
- 396 Whalley Ave
- 467 Whalley Ave Unit L
- 471 Whalley Ave Unit B
- 56 Blake St
- 22 Whittlesey Ave
- 358 Edgewood Ave
- 727 Elm St
- 341 Ellsworth Ave
- 631 Whalley Ave
- 1537 Chapel St
- 126 Derby Ave Unit A
- 800 George St
- 519 Edgewood Ave
- 525 Edgewood Ave
- 509 Edgewood Ave
- 18 Brownell St
- 17 Hobart St
- 21 Hobart St
- 24 Brownell St Unit 1
- 24 Brownell St Unit 2
- 24 Brownell St
- 24 Brownell St Unit 3
- 26 Brownell St
- 25 Hobart St
- 505 Edgewood Ave
- 11 Brownell St
- 30 Brownell St
- 31 Hobart St
- 1 W Park Ave
- 497 Edgewood Ave
- 15 Brownell St
- 20 Hobart St