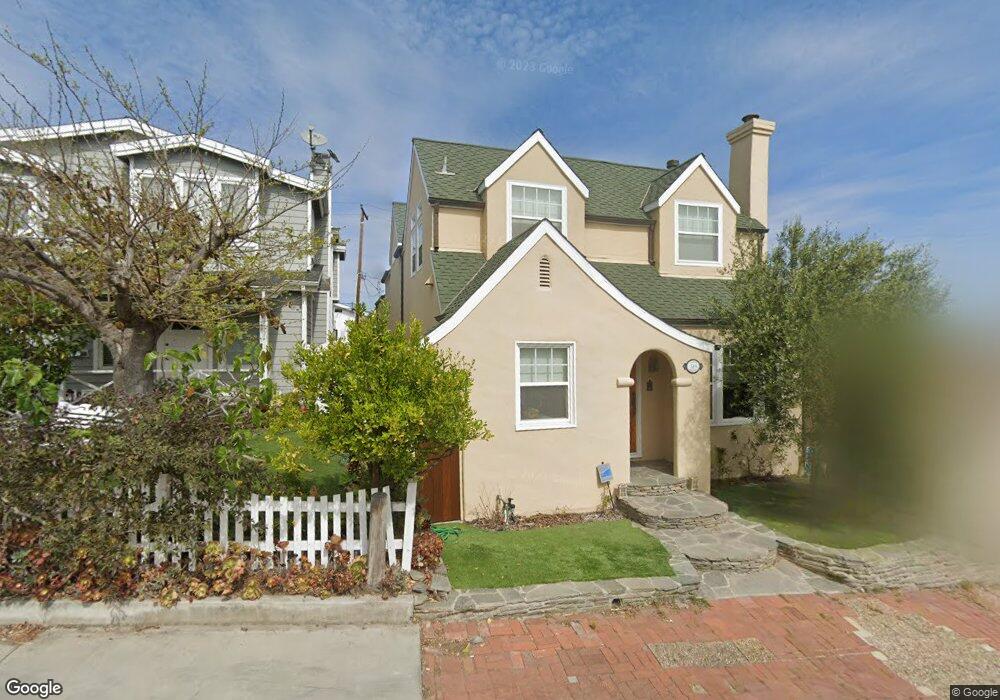
519 Marine Ave Manhattan Beach, CA 90266
Estimated Value: $2,623,553 - $4,553,000
3
Beds
3
Baths
2,272
Sq Ft
$1,612/Sq Ft
Est. Value
About This Home
This home is located at 519 Marine Ave, Manhattan Beach, CA 90266 and is currently estimated at $3,662,638, approximately $1,612 per square foot. 519 Marine Ave is a home located in Los Angeles County with nearby schools including Grand View Elementary School, Manhattan Beach Middle School, and Mira Costa High School.
Ownership History
Date
Name
Owned For
Owner Type
Purchase Details
Closed on
Jun 8, 2018
Sold by
Patterson Karen J
Bought by
Patterson Karen J and Patterson Family Trust
Current Estimated Value
Purchase Details
Closed on
Mar 26, 2007
Sold by
Patterson Robert E
Bought by
Patterson Robert E and Patterson Karen J
Purchase Details
Closed on
Aug 14, 1998
Sold by
Patterson Robert E
Bought by
Patterson Robert E and Patterson Karen J
Home Financials for this Owner
Home Financials are based on the most recent Mortgage that was taken out on this home.
Original Mortgage
$120,250
Outstanding Balance
$25,152
Interest Rate
6.95%
Estimated Equity
$3,637,486
Create a Home Valuation Report for This Property
The Home Valuation Report is an in-depth analysis detailing your home's value as well as a comparison with similar homes in the area
Home Values in the Area
Average Home Value in this Area
Purchase History
| Date | Buyer | Sale Price | Title Company |
|---|---|---|---|
| Patterson Karen J | -- | None Available | |
| Patterson Robert E | -- | None Available | |
| Patterson Robert E | -- | First American Title Ins Co |
Source: Public Records
Mortgage History
| Date | Status | Borrower | Loan Amount |
|---|---|---|---|
| Open | Patterson Robert E | $120,250 |
Source: Public Records
Tax History Compared to Growth
Tax History
| Year | Tax Paid | Tax Assessment Tax Assessment Total Assessment is a certain percentage of the fair market value that is determined by local assessors to be the total taxable value of land and additions on the property. | Land | Improvement |
|---|---|---|---|---|
| 2025 | $4,756 | $394,697 | $179,493 | $215,204 |
| 2024 | $4,756 | $386,959 | $175,974 | $210,985 |
| 2023 | $4,575 | $379,373 | $172,524 | $206,849 |
| 2022 | $4,499 | $371,936 | $169,142 | $202,794 |
| 2021 | $4,467 | $364,644 | $165,826 | $198,818 |
| 2019 | $4,441 | $341,830 | $160,908 | $180,922 |
| 2018 | $4,318 | $335,128 | $157,753 | $177,375 |
| 2016 | $3,833 | $322,117 | $151,628 | $170,489 |
| 2015 | $3,757 | $317,280 | $149,351 | $167,929 |
| 2014 | $3,716 | $311,066 | $146,426 | $164,640 |
Source: Public Records
Map
Nearby Homes