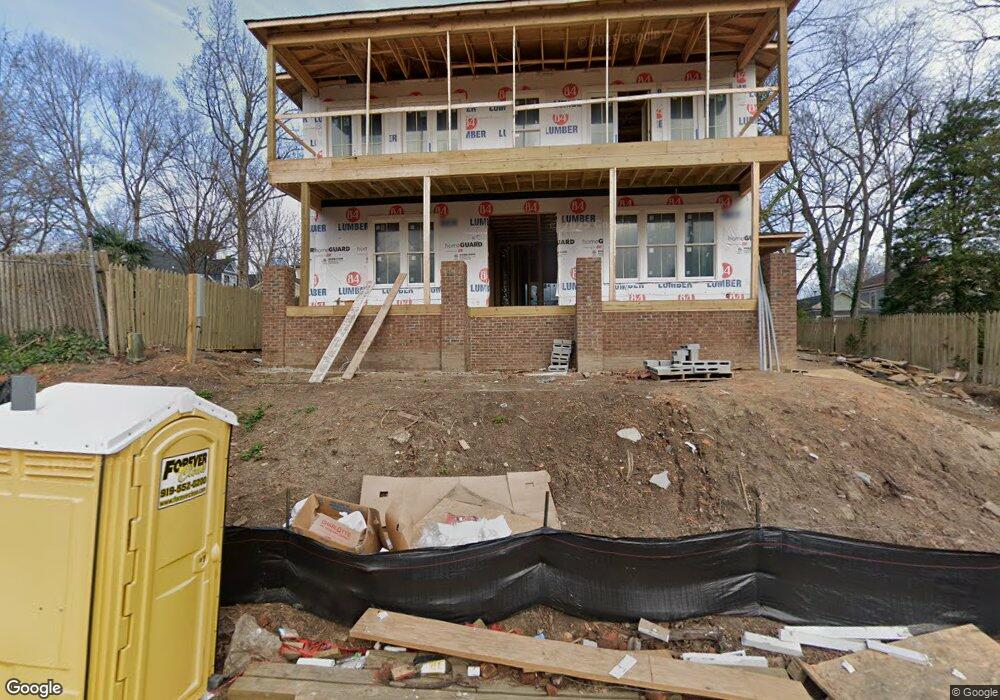
519 Mosely Ln Raleigh, NC 27601
Oakwood NeighborhoodEstimated Value: $1,130,000 - $1,292,000
--
Bed
1
Bath
3,198
Sq Ft
$374/Sq Ft
Est. Value
About This Home
This home is located at 519 Mosely Ln, Raleigh, NC 27601 and is currently estimated at $1,194,748, approximately $373 per square foot. 519 Mosely Ln is a home located in Wake County with nearby schools including Powell Elementary, Ligon Magnet Middle School, and Broughton Magnet High School.
Ownership History
Date
Name
Owned For
Owner Type
Purchase Details
Closed on
Aug 5, 2022
Sold by
Smithers Equity Group Llc
Bought by
Smith Chris J
Current Estimated Value
Purchase Details
Closed on
Apr 5, 2021
Sold by
Huct Paul J S
Bought by
Smithers Equity Group Llc
Home Financials for this Owner
Home Financials are based on the most recent Mortgage that was taken out on this home.
Original Mortgage
$221,250
Interest Rate
2.9%
Mortgage Type
Future Advance Clause Open End Mortgage
Purchase Details
Closed on
Sep 20, 2011
Sold by
Ortosky Matthew and Ortosky Diana
Bought by
Huot Paula J S
Purchase Details
Closed on
Jan 19, 2007
Sold by
Wasson Robert Joseph and Mack Julia Cardona
Bought by
Ortosky Matthew and Ortosky Diana
Home Financials for this Owner
Home Financials are based on the most recent Mortgage that was taken out on this home.
Original Mortgage
$47,500
Interest Rate
6.05%
Mortgage Type
Purchase Money Mortgage
Purchase Details
Closed on
Jan 1, 1979
Bought by
Huot Paula J S
Create a Home Valuation Report for This Property
The Home Valuation Report is an in-depth analysis detailing your home's value as well as a comparison with similar homes in the area
Home Values in the Area
Average Home Value in this Area
Purchase History
| Date | Buyer | Sale Price | Title Company |
|---|---|---|---|
| Smith Chris J | -- | Murphy Law Pllc | |
| Smithers Equity Group Llc | $295,000 | None Available | |
| Huot Paula J S | $65,000 | None Available | |
| Ortosky Matthew | $72,500 | None Available | |
| Huot Paula J S | $46,500 | -- |
Source: Public Records
Mortgage History
| Date | Status | Borrower | Loan Amount |
|---|---|---|---|
| Previous Owner | Smithers Equity Group Llc | $221,250 | |
| Previous Owner | Ortosky Matthew | $47,500 |
Source: Public Records
Tax History Compared to Growth
Tax History
| Year | Tax Paid | Tax Assessment Tax Assessment Total Assessment is a certain percentage of the fair market value that is determined by local assessors to be the total taxable value of land and additions on the property. | Land | Improvement |
|---|---|---|---|---|
| 2025 | $3,253 | $943,986 | $300,000 | $643,986 |
| 2024 | $8,219 | $943,986 | $300,000 | $643,986 |
| 2023 | $6,055 | $553,641 | $162,000 | $391,641 |
| 2022 | $2,776 | $274,200 | $162,000 | $112,200 |
| 2021 | $1,576 | $162,000 | $162,000 | $0 |
| 2020 | $2,540 | $162,000 | $162,000 | $0 |
| 2019 | $714 | $77,000 | $77,000 | $0 |
| 2018 | $505 | $77,000 | $77,000 | $0 |
| 2017 | $641 | $77,000 | $77,000 | $0 |
| 2016 | $635 | $77,000 | $77,000 | $0 |
| 2015 | $507 | $97,920 | $97,920 | $0 |
| 2014 | -- | $97,920 | $97,920 | $0 |
Source: Public Records
Map
Nearby Homes
- 536 E Jones St
- 521 E Edenton St
- 225 Elm St
- 537 New Bern Ave Unit 101
- 304 Linden Ave
- 216 N Bloodworth St
- 406 E Lane St
- 712 E Edenton St Unit 102
- 318 Cooke St
- 801 New Bern Ave Unit 102
- 2 Seawell Ave Unit 101
- 419 Watauga St
- 810 E Edenton St
- 315 Oakwood Ave
- 138 S East St
- 149 S Bloodworth St
- 820 New Bern Ave Unit 820-822-824-826
- 203 Heck St
- 207 Heck St
- 105 Heck St
- 519 Mosely Ln Unit 2
- 530 E Jones St
- 534 E Jones St
- 538 E Jones St
- 520 Mosely Ln
- 524 Mosely Ln
- 542 E Jones St
- 528 E Jones St
- 524 Moseley Ln
- 500 Moseley Ln
- 531 Mosely Ln
- 528 Mosely Ln
- 546 E Jones St
- 504 Moseley Ln
- 541 E Edenton St
- 532 Mosely Ln
- 500 Mosely Ln
- 537 E Edenton St
- 533 E Edenton St
- 504 Mosely Ln