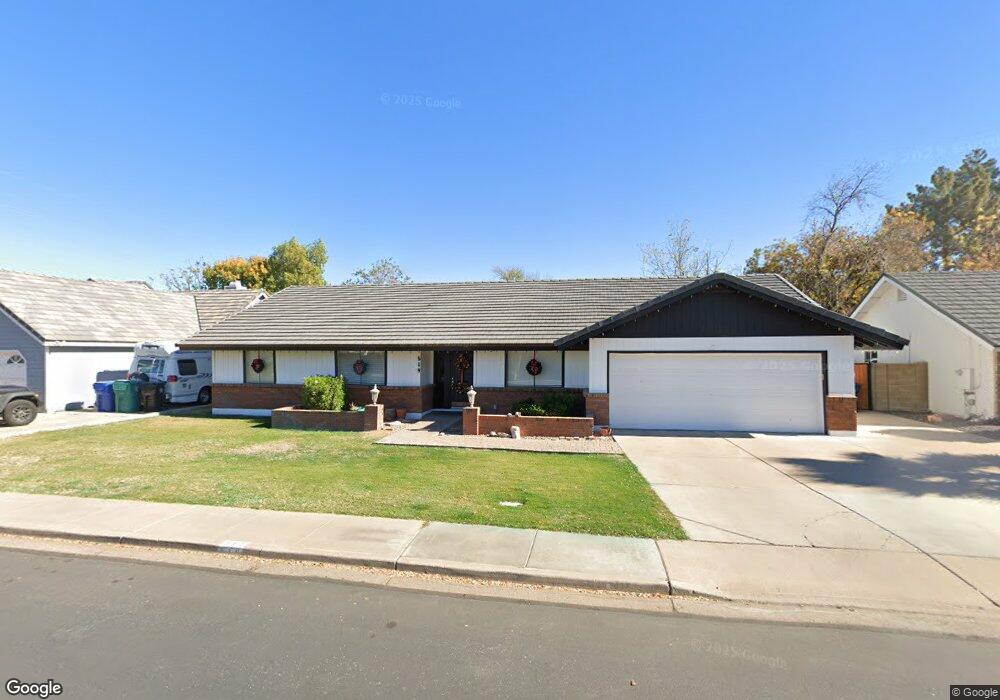
519 N Maple Mesa, AZ 85205
The Groves NeighborhoodEstimated Value: $451,000 - $582,000
Studio
3
Baths
2,243
Sq Ft
$229/Sq Ft
Est. Value
About This Home
This home is located at 519 N Maple, Mesa, AZ 85205 and is currently estimated at $513,731, approximately $229 per square foot. 519 N Maple is a home located in Maricopa County with nearby schools including Entz Elementary School, Franklin at Brimhall Elementary School, and Franklin West Elementary School.
Ownership History
Date
Name
Owned For
Owner Type
Purchase Details
Closed on
Jan 25, 2005
Sold by
Fuller Newell Judd
Bought by
Fuller Newell Judd and Fuller Lynda R
Current Estimated Value
Home Financials for this Owner
Home Financials are based on the most recent Mortgage that was taken out on this home.
Original Mortgage
$50,000
Interest Rate
5.67%
Mortgage Type
Credit Line Revolving
Purchase Details
Closed on
Feb 13, 1995
Sold by
Homer Bradley J and Homer Jill J
Bought by
Fuller Newell Judd and Fuller Lynda Rae
Home Financials for this Owner
Home Financials are based on the most recent Mortgage that was taken out on this home.
Original Mortgage
$87,577
Interest Rate
9.23%
Mortgage Type
FHA
Create a Home Valuation Report for This Property
The Home Valuation Report is an in-depth analysis detailing your home's value as well as a comparison with similar homes in the area
Home Values in the Area
Average Home Value in this Area
Purchase History
| Date | Buyer | Sale Price | Title Company |
|---|---|---|---|
| Fuller Newell Judd | -- | Transnation Title | |
| Fuller Newell Judd | -- | Transnation Title | |
| Fuller Newell Judd | $88,000 | Transamerica Title Ins Co |
Source: Public Records
Mortgage History
| Date | Status | Borrower | Loan Amount |
|---|---|---|---|
| Closed | Fuller Newell Judd | $50,000 | |
| Closed | Fuller Newell Judd | $87,577 |
Source: Public Records
Tax History
| Year | Tax Paid | Tax Assessment Tax Assessment Total Assessment is a certain percentage of the fair market value that is determined by local assessors to be the total taxable value of land and additions on the property. | Land | Improvement |
|---|---|---|---|---|
| 2025 | $1,922 | $22,690 | -- | -- |
| 2024 | $1,943 | $21,609 | -- | -- |
| 2023 | $1,943 | $36,360 | $7,270 | $29,090 |
| 2022 | $1,901 | $28,720 | $5,740 | $22,980 |
| 2021 | $1,946 | $27,500 | $5,500 | $22,000 |
| 2020 | $1,919 | $25,420 | $5,080 | $20,340 |
| 2019 | $1,780 | $23,360 | $4,670 | $18,690 |
| 2018 | $1,698 | $22,010 | $4,400 | $17,610 |
| 2017 | $1,646 | $20,900 | $4,180 | $16,720 |
| 2016 | $1,608 | $20,450 | $4,090 | $16,360 |
| 2015 | $1,523 | $19,220 | $3,840 | $15,380 |
Source: Public Records
Map
Nearby Homes
- 625 N 38th St
- 3716 E University Dr Unit 2014
- 3716 E University Dr Unit 2016
- 3716 E University Dr Unit C2010
- 4065 E University Dr Unit 433
- 4065 E University Dr Unit 50
- 4065 E University Dr Unit 430
- 4065 E University Dr Unit 136
- 4065 E University Dr Unit 516
- 4065 E University Dr Unit 456
- 4065 E University Dr Unit 344
- 4065 E University Dr Unit 58
- 4065 E University Dr Unit 285
- 4065 E University Dr Unit 332
- 4065 E University Dr Unit 526
- 4065 E University Dr Unit 528
- 4065 E University Dr Unit 83
- 4065 E University Dr Unit 482
- 4065 E University Dr Unit 534
- 4065 E University Dr Unit 439
- 511 N Maple
- 533 N Maple
- 503 N Maple
- 3847 E Covina St
- 539 N Maple
- 3845 E Contessa St
- 3838 E Contessa St
- 463 N Maple
- 3837 E Covina St
- 3854 E Covina St
- 520 N 39th Way
- 3846 E Covina St
- 532 N 39th Way
- 3835 E Contessa St
- 508 N 39th Way
- 3830 E Contessa St
- 3829 E Covina St
- 3836 E Covina St
- 3844 E Caballero Cir
- 3852 E Caballero Cir
Your Personal Tour Guide
Ask me questions while you tour the home.