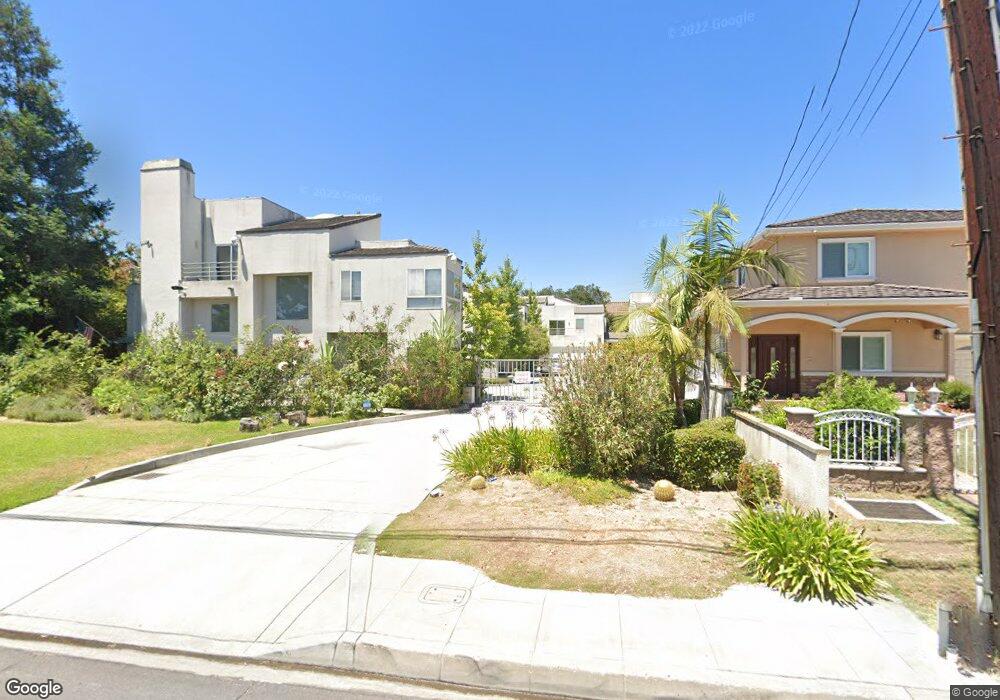
519 S 3rd Ave Unit D Arcadia, CA 91006
Estimated Value: $1,217,000 - $1,603,000
3
Beds
3
Baths
2,628
Sq Ft
$519/Sq Ft
Est. Value
About This Home
This home is located at 519 S 3rd Ave Unit D, Arcadia, CA 91006 and is currently estimated at $1,363,695, approximately $518 per square foot. 519 S 3rd Ave Unit D is a home located in Los Angeles County with nearby schools including Camino Grove Elementary School, Richard Henry Dana Middle School, and Arcadia High School.
Ownership History
Date
Name
Owned For
Owner Type
Purchase Details
Closed on
Sep 11, 2015
Sold by
Lin Daniel Yuenchung
Bought by
Lily Liwan Hu Family Irrevocable Trust
Current Estimated Value
Purchase Details
Closed on
May 19, 2015
Sold by
Liu Lily Li Wan
Bought by
Hu Lily Liwan and The Lily Liwan Hu Family Trust
Purchase Details
Closed on
Oct 16, 2012
Sold by
Huang Cynthia Y
Bought by
Liu Lily Li Wan and Lin Daniel Yuen Chung
Purchase Details
Closed on
Oct 20, 2010
Sold by
Silverstream Exchange Company Llc
Bought by
Huang Cynthia Y
Purchase Details
Closed on
Feb 10, 2010
Sold by
Huang Cynthia Y
Bought by
Silverstream Exchange Company Llc
Purchase Details
Closed on
Jun 7, 2006
Sold by
Huang Christopher
Bought by
Huang Cynthia Y
Purchase Details
Closed on
Jan 30, 2003
Sold by
Winco Development Inc
Bought by
Huang Christopher
Create a Home Valuation Report for This Property
The Home Valuation Report is an in-depth analysis detailing your home's value as well as a comparison with similar homes in the area
Home Values in the Area
Average Home Value in this Area
Purchase History
| Date | Buyer | Sale Price | Title Company |
|---|---|---|---|
| Lily Liwan Hu Family Irrevocable Trust | -- | None Available | |
| Hu Lily Liwan | -- | None Available | |
| Liu Lily Li Wan | $650,000 | Lawyers Title | |
| Huang Cynthia Y | -- | None Available | |
| Silverstream Exchange Company Llc | -- | None Available | |
| Huang Cynthia Y | -- | None Available | |
| Huang Christopher | -- | -- |
Source: Public Records
Tax History
| Year | Tax Paid | Tax Assessment Tax Assessment Total Assessment is a certain percentage of the fair market value that is determined by local assessors to be the total taxable value of land and additions on the property. | Land | Improvement |
|---|---|---|---|---|
| 2025 | $12,140 | $1,072,514 | $426,164 | $646,350 |
| 2024 | $12,140 | $1,051,485 | $417,808 | $633,677 |
| 2023 | $11,889 | $1,030,868 | $409,616 | $621,252 |
| 2022 | $11,500 | $1,010,656 | $401,585 | $609,071 |
| 2021 | $11,286 | $990,840 | $393,711 | $597,129 |
| 2019 | $11,015 | $961,453 | $382,034 | $579,419 |
| 2018 | $10,749 | $942,602 | $374,544 | $568,058 |
| 2016 | $10,489 | $906,000 | $360,000 | $546,000 |
| 2015 | $7,832 | $665,995 | $381,154 | $284,841 |
| 2014 | $7,726 | $652,950 | $373,688 | $279,262 |
Source: Public Records
Map
Nearby Homes
- 154 Diamond St Unit B
- 527 S 5th Ave Unit B
- 135 Diamond St
- 125 Diamond St Unit H
- 147 California St
- 424 Genoa St
- 200 S 2nd Ave Unit A
- 200 S 2nd Ave Unit B
- 200 S 2nd Ave Unit D
- 200 S 2nd Ave Unit C
- 415 California St Unit D
- 417 California St Unit F
- 215 S 5th Ave Unit A
- 57 Alice St Unit A
- 45 Genoa St Unit A
- 32 Diamond St Unit D
- 25 Fano St
- 910 S 5th Ave
- 56 E Duarte Rd Unit 318
- 56 E Duarte Rd Unit 418
- 519 S 3rd Ave Unit E
- 519 S 3rd Ave Unit C
- 519 S 3rd Ave Unit B
- 519 S 3rd Ave Unit A
- 515 S 3rd Ave
- 523 S 3rd Ave Unit B
- 523 S 3rd Ave Unit A
- 511 S 3rd Ave
- 220 El Dorado St
- 588 S 2nd Ave Unit A
- 578 S 2nd Ave
- 588 S 2nd Ave
- 507 S 3rd Ave
- 220 Eldorado St
- 218 Eldorado St
- 536 S 2nd Ave
- 556 S 2nd Ave
- 516 S 2nd Ave
- 586 S 2nd Ave Unit A
- 538 S 2nd Ave Unit B
Your Personal Tour Guide
Ask me questions while you tour the home.