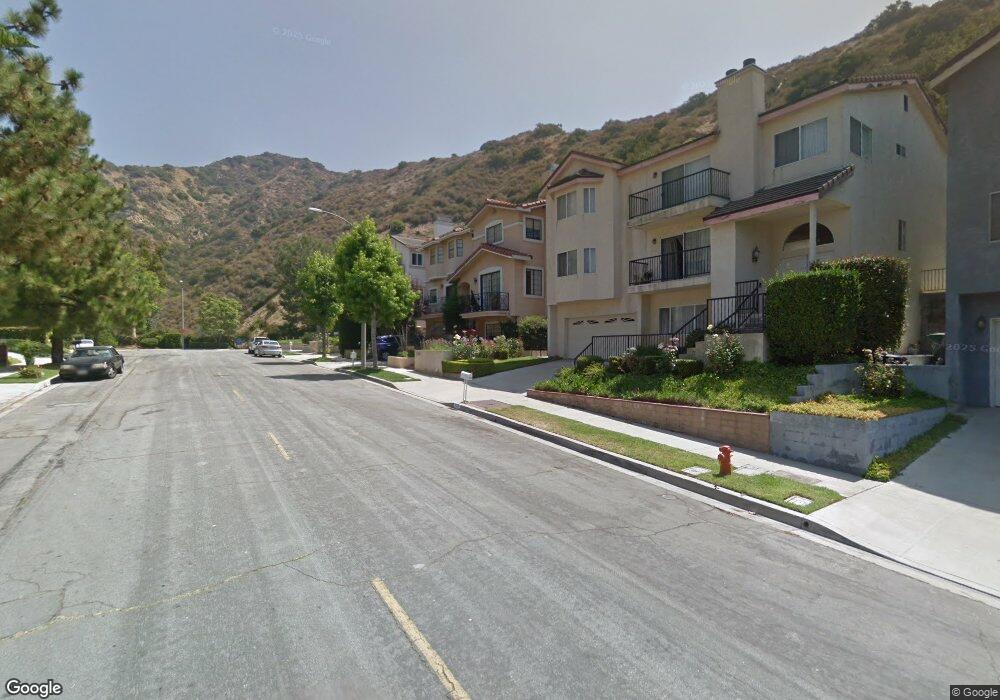
519 S Vía Montana Burbank, CA 91501
Hillside District NeighborhoodEstimated Value: $2,036,622 - $2,683,000
5
Beds
6
Baths
3,771
Sq Ft
$626/Sq Ft
Est. Value
About This Home
This home is located at 519 S Vía Montana, Burbank, CA 91501 and is currently estimated at $2,360,906, approximately $626 per square foot. 519 S Vía Montana is a home located in Los Angeles County with nearby schools including Ralph Emerson Elementary School, John Muir Middle School, and Burbank High School.
Ownership History
Date
Name
Owned For
Owner Type
Purchase Details
Closed on
Nov 29, 2012
Sold by
Liau Gavin and Liau Yong Yee
Bought by
Gizma Holdings Inc
Current Estimated Value
Home Financials for this Owner
Home Financials are based on the most recent Mortgage that was taken out on this home.
Original Mortgage
$315,000
Outstanding Balance
$55,755
Interest Rate
3.33%
Mortgage Type
New Conventional
Estimated Equity
$2,305,151
Purchase Details
Closed on
Oct 26, 2012
Sold by
Gizma Holdings Inc
Bought by
Eng Herman and Eng Shelly
Home Financials for this Owner
Home Financials are based on the most recent Mortgage that was taken out on this home.
Original Mortgage
$315,000
Outstanding Balance
$55,755
Interest Rate
3.33%
Mortgage Type
New Conventional
Estimated Equity
$2,305,151
Purchase Details
Closed on
Apr 1, 2012
Sold by
Liau Gavin and Liau Yong Yee
Bought by
Gizma Holdings Inc
Home Financials for this Owner
Home Financials are based on the most recent Mortgage that was taken out on this home.
Original Mortgage
$373,996
Interest Rate
3.25%
Mortgage Type
Seller Take Back
Create a Home Valuation Report for This Property
The Home Valuation Report is an in-depth analysis detailing your home's value as well as a comparison with similar homes in the area
Home Values in the Area
Average Home Value in this Area
Purchase History
| Date | Buyer | Sale Price | Title Company |
|---|---|---|---|
| Gizma Holdings Inc | -- | Lawyers Title | |
| Eng Herman | $975,000 | Lawyers Title | |
| Gizma Holdings Inc | $995,000 | None Available |
Source: Public Records
Mortgage History
| Date | Status | Borrower | Loan Amount |
|---|---|---|---|
| Open | Eng Herman | $315,000 | |
| Previous Owner | Gizma Holdings Inc | $373,996 |
Source: Public Records
Tax History Compared to Growth
Tax History
| Year | Tax Paid | Tax Assessment Tax Assessment Total Assessment is a certain percentage of the fair market value that is determined by local assessors to be the total taxable value of land and additions on the property. | Land | Improvement |
|---|---|---|---|---|
| 2025 | $13,290 | $1,200,629 | $571,499 | $629,130 |
| 2024 | $13,290 | $1,177,089 | $560,294 | $616,795 |
| 2023 | $13,149 | $1,154,009 | $549,308 | $604,701 |
| 2022 | $12,554 | $1,131,383 | $538,538 | $592,845 |
| 2021 | $12,494 | $1,109,200 | $527,979 | $581,221 |
| 2020 | $12,355 | $1,097,828 | $522,566 | $575,262 |
| 2019 | $11,988 | $1,076,303 | $512,320 | $563,983 |
| 2018 | $11,894 | $1,055,200 | $502,275 | $552,925 |
| 2016 | $11,279 | $1,014,227 | $482,772 | $531,455 |
| 2015 | $11,051 | $998,994 | $475,521 | $523,473 |
| 2014 | $11,017 | $979,426 | $466,207 | $513,219 |
Source: Public Records
Map
Nearby Homes
- 1218 E Tujunga Ave
- 1220 E Providencia Ave
- 0 Country Club Dr Unit SB24168055
- 660 Country Club Dr
- 840 Country Club Dr
- 701 Country Club Dr
- 709 Wilson Ct
- 1258 E Elmwood Ave
- 1369 Paseo Redondo
- 1042 E Tujunga Ave
- 828 S Sunset Canyon Dr
- 1004 La Rambla Dr
- 310 S Bel Aire Dr
- 1794 Thurber Place
- 217 N Bel Aire Dr
- 938 E Palm Ave
- 900 E Santa Anita Ave
- 1025 E San Jose Ave
- 1000 E San Jose Ave
- 2005 Chilton Dr
- 519 S Via Montana
- 515 S Via Montana
- 515 S Via Montana
- 521 S Via Montana
- 511 S Via Montana
- 523 S Via Montana
- 516 S Via Montana
- 520 S Via Montana
- 512 S Via Montana
- 509 S Via Montana
- 528 S Via Montana
- 504 S Via Montana
- 1855 Ayers Way
- 1856 Ayers Way
- 1746 Rudell Rd
- 500 S Via Montana
- 508 S Via Montana
- 1851 Ayers Way
- 1852 Ayers Way
- 1742 Rudell Rd