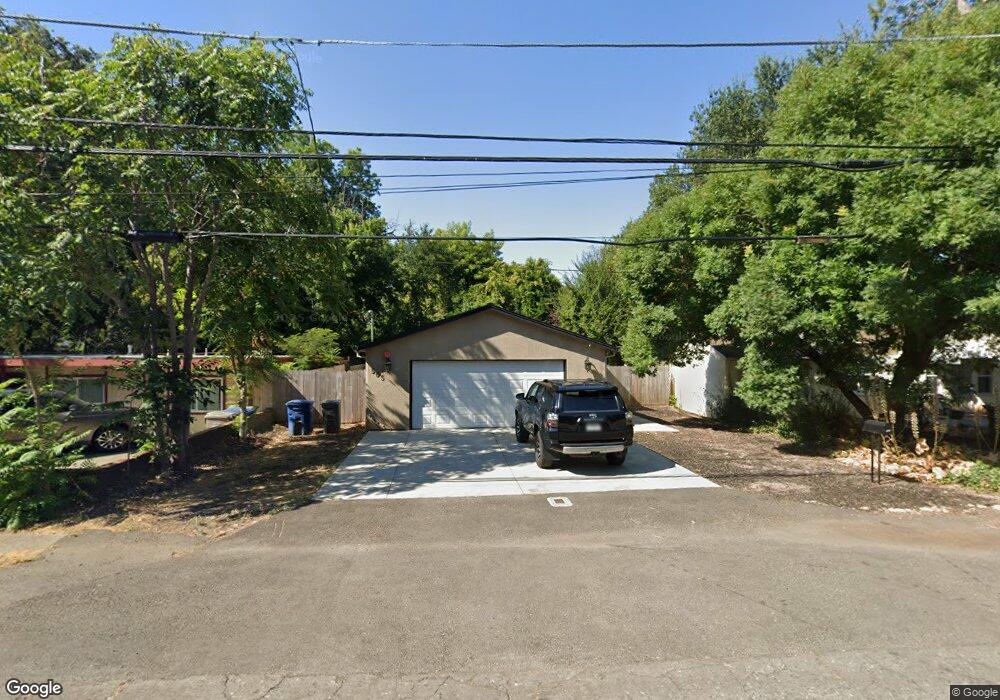
519 Smile Place Redding, CA 96001
Parkview NeighborhoodEstimated Value: $242,000 - $374,000
3
Beds
1
Bath
1,522
Sq Ft
$196/Sq Ft
Est. Value
About This Home
This home is located at 519 Smile Place, Redding, CA 96001 and is currently estimated at $298,863, approximately $196 per square foot. 519 Smile Place is a home located in Shasta County with nearby schools including Juniper, Sequoia Middle School, and Shasta High School.
Ownership History
Date
Name
Owned For
Owner Type
Purchase Details
Closed on
Feb 12, 2004
Sold by
Taylor John M
Bought by
Taylor John M and Taylor Julie
Current Estimated Value
Home Financials for this Owner
Home Financials are based on the most recent Mortgage that was taken out on this home.
Original Mortgage
$121,000
Interest Rate
5.85%
Mortgage Type
New Conventional
Purchase Details
Closed on
Mar 29, 2001
Sold by
Taylor John and Taylor Julie
Bought by
Taylor John M
Home Financials for this Owner
Home Financials are based on the most recent Mortgage that was taken out on this home.
Original Mortgage
$77,500
Interest Rate
7.19%
Create a Home Valuation Report for This Property
The Home Valuation Report is an in-depth analysis detailing your home's value as well as a comparison with similar homes in the area
Home Values in the Area
Average Home Value in this Area
Purchase History
| Date | Buyer | Sale Price | Title Company |
|---|---|---|---|
| Taylor John M | -- | Multiple | |
| Taylor John M | -- | Fidelity National Title Co |
Source: Public Records
Mortgage History
| Date | Status | Borrower | Loan Amount |
|---|---|---|---|
| Closed | Taylor John M | $121,000 | |
| Closed | Taylor John M | $77,500 |
Source: Public Records
Tax History
| Year | Tax Paid | Tax Assessment Tax Assessment Total Assessment is a certain percentage of the fair market value that is determined by local assessors to be the total taxable value of land and additions on the property. | Land | Improvement |
|---|---|---|---|---|
| 2025 | $1,241 | $124,560 | $29,886 | $94,674 |
| 2024 | $1,221 | $122,118 | $29,300 | $92,818 |
| 2023 | $1,221 | $119,725 | $28,726 | $90,999 |
| 2022 | $1,198 | $117,378 | $28,163 | $89,215 |
| 2021 | $1,190 | $115,077 | $27,611 | $87,466 |
| 2020 | $1,205 | $113,898 | $27,328 | $86,570 |
| 2019 | $1,143 | $111,666 | $26,793 | $84,873 |
| 2018 | $1,151 | $109,477 | $26,268 | $83,209 |
| 2017 | $1,143 | $107,331 | $25,753 | $81,578 |
| 2016 | $1,106 | $105,228 | $25,249 | $79,979 |
| 2015 | $1,091 | $103,648 | $24,870 | $78,778 |
| 2014 | -- | $101,618 | $24,383 | $77,235 |
Source: Public Records
Map
Nearby Homes
- 409 Smile Place
- 745 Parkview Ave
- 864 Kite Ln
- 351 Weldon St
- 1012 State St
- 2590 Henderson Rd
- 2514 California St
- 2405 Cliff Dr
- 2476 California St
- 350 Park Marina Cir
- 3244 Veda St
- 632 South St
- 2239 Garden Ave
- 2056 Canal Dr
- 2284 Paris Ave
- 2123 Waldon St
- 3443 West St
- 2165 Paris Ave
- 2630 Wyndham Ln
- 3425 Riverview Dr
- 2568 Russell St
- 2566 Russell St
- 2574 Russell St
- 2556 Russell St
- 2606 Russell St
- 2572 Russell St
- 2604 2606 Russell St
- 645 State St
- 633 State St
- 625 State St
- 651 State St
- 505 Smile Place
- 2604 Russell St
- 617 State St
- 2610 Russell St
- 517 Smile Place
- 501 Smile Place
- 609 State St
- 701 Leland Ct
- 657 State St
Your Personal Tour Guide
Ask me questions while you tour the home.