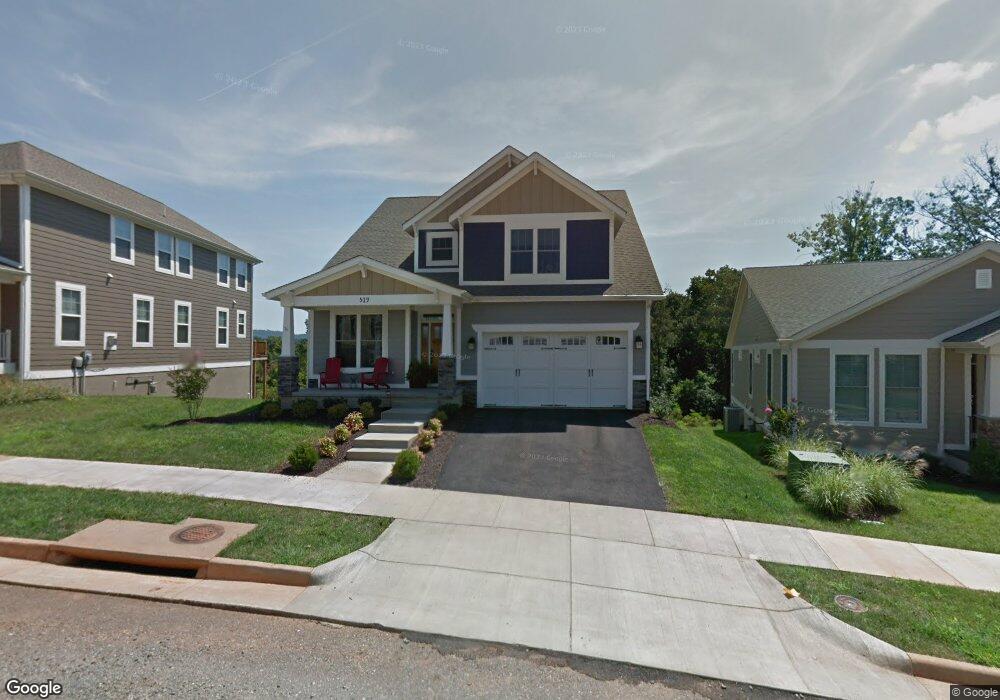
519 Tyree Ln Charlottesville, VA 22901
Dunlora NeighborhoodEstimated Value: $735,485 - $855,000
4
Beds
4
Baths
2,774
Sq Ft
$287/Sq Ft
Est. Value
About This Home
This home is located at 519 Tyree Ln, Charlottesville, VA 22901 and is currently estimated at $797,371, approximately $287 per square foot. 519 Tyree Ln is a home located in Albemarle County with nearby schools including Agnor Elementary School, Jackson P. Burley Middle School, and Albemarle High School.
Ownership History
Date
Name
Owned For
Owner Type
Purchase Details
Closed on
Oct 26, 2011
Sold by
Hauser Homes Llc
Bought by
Wendell W Gibson Inc
Current Estimated Value
Purchase Details
Closed on
Oct 7, 2011
Sold by
Hauser Homes Llc
Bought by
Wendell W Gibson Inc
Create a Home Valuation Report for This Property
The Home Valuation Report is an in-depth analysis detailing your home's value as well as a comparison with similar homes in the area
Home Values in the Area
Average Home Value in this Area
Purchase History
| Date | Buyer | Sale Price | Title Company |
|---|---|---|---|
| Wendell W Gibson Inc | -- | None Available | |
| Wendell W Gibson Inc | -- | None Available |
Source: Public Records
Tax History
| Year | Tax Paid | Tax Assessment Tax Assessment Total Assessment is a certain percentage of the fair market value that is determined by local assessors to be the total taxable value of land and additions on the property. | Land | Improvement |
|---|---|---|---|---|
| 2025 | $6,341 | $709,300 | $205,000 | $504,300 |
| 2024 | $5,574 | $652,700 | $175,000 | $477,700 |
| 2023 | $5,270 | $617,100 | $175,000 | $442,100 |
| 2022 | $4,762 | $557,600 | $160,000 | $397,600 |
| 2021 | $4,161 | $487,200 | $160,000 | $327,200 |
| 2020 | $4,232 | $495,500 | $175,500 | $320,000 |
| 2019 | $3,943 | $461,700 | $157,300 | $304,400 |
| 2018 | $3,755 | $453,700 | $157,300 | $296,400 |
| 2017 | $3,703 | $441,300 | $145,200 | $296,100 |
| 2016 | $3,643 | $434,200 | $145,200 | $289,000 |
| 2015 | $1,714 | $418,500 | $145,200 | $273,300 |
| 2014 | -- | $405,500 | $145,200 | $260,300 |
Source: Public Records
Map
Nearby Homes
- 1421 Butler St
- 1417 Farrow Hill Ct
- 1311 Dabney Grove
- 21 Farrow Dr
- 51 Farrow Dr
- 3061 Farrow Dr
- 1603 Griffen Grove
- 34 Fowler St
- 1226 Farrow Dr
- 1230 Dunlora Dr
- 37 Fowler St
- 2240 Fowler Cir
- 3617 Hilah Ln
- 1737 Fowler St
- 1259 Farrow Dr
- 2206 Fowler Cir
- 48A Miranda Crossing
- 46 Miranda Crossing
- 65 Miranda Crossing
- 73 Miranda Crossing
Your Personal Tour Guide
Ask me questions while you tour the home.