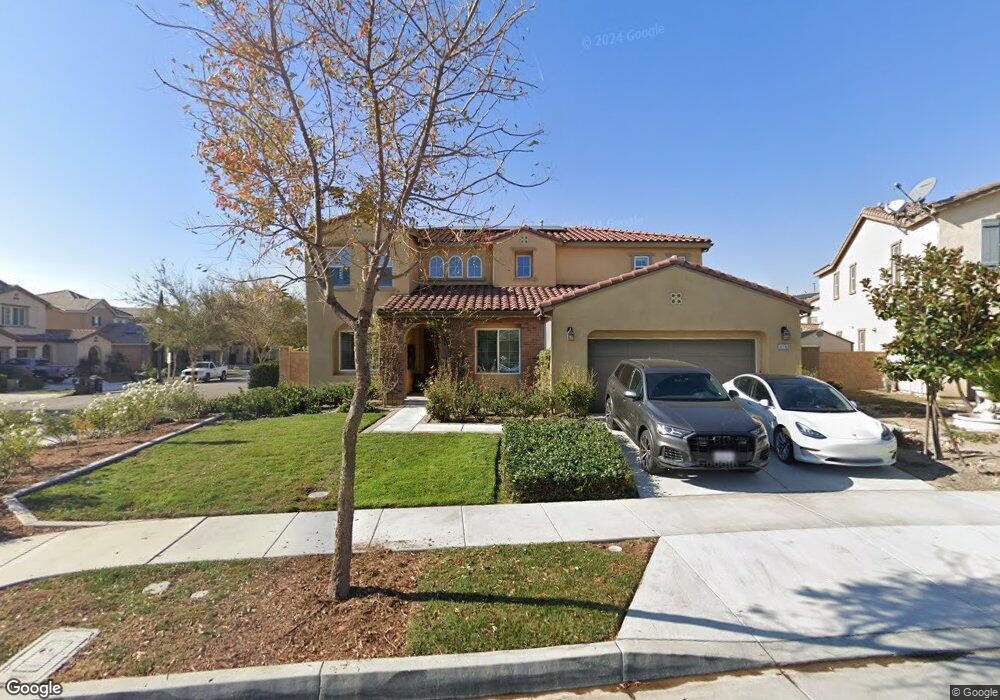
5190 Salisbury Way Ontario, CA 91762
Ontario Ranch NeighborhoodEstimated Value: $972,000 - $1,157,000
4
Beds
4
Baths
3,199
Sq Ft
$326/Sq Ft
Est. Value
About This Home
This home is located at 5190 Salisbury Way, Ontario, CA 91762 and is currently estimated at $1,043,449, approximately $326 per square foot. 5190 Salisbury Way is a home with nearby schools including Ranch View Elementary School, Grace Yokley Middle School, and Colony High.
Ownership History
Date
Name
Owned For
Owner Type
Purchase Details
Closed on
May 26, 2021
Sold by
Xu Pam Pan and Dai Pamela P
Bought by
Xu Pam Pan
Current Estimated Value
Home Financials for this Owner
Home Financials are based on the most recent Mortgage that was taken out on this home.
Original Mortgage
$87,600
Outstanding Balance
$79,311
Interest Rate
2.9%
Mortgage Type
Credit Line Revolving
Estimated Equity
$964,138
Purchase Details
Closed on
Mar 19, 2021
Sold by
Zhao Jueying
Bought by
Xu Pam Pan
Purchase Details
Closed on
Nov 21, 2016
Sold by
Dai Bing
Bought by
Dai Pamela P
Purchase Details
Closed on
Sep 12, 2016
Sold by
Woodside O5s Lp
Bought by
Dai Pamela P
Home Financials for this Owner
Home Financials are based on the most recent Mortgage that was taken out on this home.
Original Mortgage
$421,106
Interest Rate
3.87%
Mortgage Type
Adjustable Rate Mortgage/ARM
Create a Home Valuation Report for This Property
The Home Valuation Report is an in-depth analysis detailing your home's value as well as a comparison with similar homes in the area
Home Values in the Area
Average Home Value in this Area
Purchase History
| Date | Buyer | Sale Price | Title Company |
|---|---|---|---|
| Xu Pam Pan | -- | Fidelity National Title Co | |
| Xu Pam Pan | -- | Fidelity National Title | |
| Dai Pamela P | -- | Fidelity National Title Co | |
| Dai Pamela P | $602,000 | Fntg |
Source: Public Records
Mortgage History
| Date | Status | Borrower | Loan Amount |
|---|---|---|---|
| Open | Xu Pam Pan | $87,600 | |
| Previous Owner | Dai Pamela P | $421,106 |
Source: Public Records
Tax History Compared to Growth
Tax History
| Year | Tax Paid | Tax Assessment Tax Assessment Total Assessment is a certain percentage of the fair market value that is determined by local assessors to be the total taxable value of land and additions on the property. | Land | Improvement |
|---|---|---|---|---|
| 2025 | $11,726 | $698,185 | $244,364 | $453,821 |
| 2024 | $11,726 | $684,496 | $239,573 | $444,923 |
| 2023 | $11,370 | $671,074 | $234,875 | $436,199 |
| 2022 | $11,268 | $657,916 | $230,270 | $427,646 |
| 2021 | $11,708 | $645,016 | $225,755 | $419,261 |
| 2020 | $11,430 | $638,402 | $223,440 | $414,962 |
| 2019 | $11,390 | $625,884 | $219,059 | $406,825 |
| 2018 | $11,169 | $613,612 | $214,764 | $398,848 |
| 2017 | $11,050 | $607,098 | $244,098 | $363,000 |
| 2016 | $7,219 | $239,312 | $239,312 | $0 |
| 2015 | $2,605 | $235,717 | $235,717 | $0 |
Source: Public Records
Map
Nearby Homes
- 2772 Crown Ct
- 5092 S Kensington Ave
- 6073 Sendero Ave
- 5032 S Heritage Paseo
- 5073 S Heritage Paseo
- 5869 Oatfield Ave
- 5857 Oatfield Ave
- 5873 Oatfield Ave
- 13893 La Pradera Way
- 2829 E Clementine Dr
- 4967 S Tangerine Way
- 3137 E Discovery St
- 4858 S Avocado Trail
- 3144 E Chip Smith Way
- 4877 S Avocado Trail
- 4863 S Bountiful Trail
- 3108 E Painted Crescent St
- 3137 E Chip Smith Way
- 3126 E Painted Crescent St
- 2621 E Clara Ln
- 5184 Salisbury Way
- 2785 Arbor Ln
- 2762 Crown Ct
- 2773 Arbor Ln
- 5180 Salisbury Way
- 2792 Arbor Ln
- 2811 Arbor Ln
- 2794 Arbor Ln
- 2786 Arbor Ln
- 2808 E Arbor Ln
- 2752 Crown Ct
- 2772 Arbor Ln
- 2765 Arbor Ln
- 5170 Salisbury Way
- 2814 E Arbor Ln
- 5171 Salisbury Way
- 2821 Arbor Ln
- 2762 Arbor Ln
- 2742 Crown Ct
- 2753 Arbor Ln