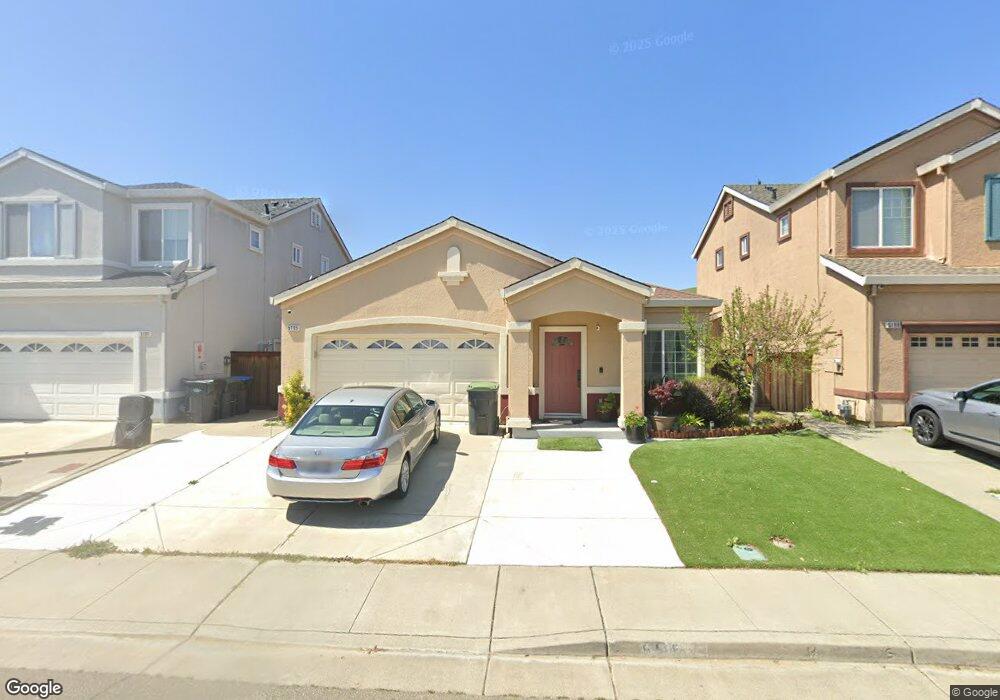
5195 Wb Goodman Ln Unit L Fairfield, CA 94533
Estimated Value: $590,000 - $657,000
3
Beds
2
Baths
1,665
Sq Ft
$374/Sq Ft
Est. Value
About This Home
This home is located at 5195 Wb Goodman Ln Unit L, Fairfield, CA 94533 and is currently estimated at $623,402, approximately $374 per square foot. 5195 Wb Goodman Ln Unit L is a home located in Solano County with nearby schools including Center Elementary School, Golden West Middle School, and Vanden High School.
Ownership History
Date
Name
Owned For
Owner Type
Purchase Details
Closed on
Jan 27, 2022
Sold by
Trigg Karen L
Bought by
Cornejo Emelinda S and Cornejo Edward O
Current Estimated Value
Purchase Details
Closed on
Jun 22, 2009
Sold by
Federal National Mortgage Association
Bought by
Trigg Karen L
Home Financials for this Owner
Home Financials are based on the most recent Mortgage that was taken out on this home.
Original Mortgage
$233,689
Interest Rate
5.25%
Mortgage Type
FHA
Purchase Details
Closed on
Apr 17, 2009
Sold by
Anthony Bruce W and Anthony Paola G
Bought by
Federal National Mortgage Association
Purchase Details
Closed on
Dec 28, 2001
Sold by
Schuler Homes Of California Inc
Bought by
Anthony Bruce W and Anthony Paola G
Home Financials for this Owner
Home Financials are based on the most recent Mortgage that was taken out on this home.
Original Mortgage
$243,150
Interest Rate
6.51%
Create a Home Valuation Report for This Property
The Home Valuation Report is an in-depth analysis detailing your home's value as well as a comparison with similar homes in the area
Home Values in the Area
Average Home Value in this Area
Purchase History
| Date | Buyer | Sale Price | Title Company |
|---|---|---|---|
| Cornejo Emelinda S | $620,500 | Placer Title | |
| Trigg Karen L | $238,000 | Stewart Title Of California | |
| Federal National Mortgage Association | $391,817 | Accommodation | |
| Anthony Bruce W | $256,000 | First American Title Guarant |
Source: Public Records
Mortgage History
| Date | Status | Borrower | Loan Amount |
|---|---|---|---|
| Previous Owner | Trigg Karen L | $233,689 | |
| Previous Owner | Anthony Bruce W | $243,150 |
Source: Public Records
Tax History Compared to Growth
Tax History
| Year | Tax Paid | Tax Assessment Tax Assessment Total Assessment is a certain percentage of the fair market value that is determined by local assessors to be the total taxable value of land and additions on the property. | Land | Improvement |
|---|---|---|---|---|
| 2025 | $8,344 | $658,372 | $196,323 | $462,049 |
| 2024 | $8,344 | $645,464 | $192,474 | $452,990 |
| 2023 | $8,233 | $632,808 | $188,700 | $444,108 |
| 2022 | $4,529 | $289,488 | $97,306 | $192,182 |
| 2021 | $4,466 | $283,813 | $95,399 | $188,414 |
| 2020 | $4,405 | $280,904 | $94,421 | $186,483 |
| 2019 | $4,330 | $275,397 | $92,570 | $182,827 |
| 2018 | $4,273 | $269,998 | $90,755 | $179,243 |
| 2017 | $4,156 | $264,705 | $88,976 | $175,729 |
| 2016 | $4,097 | $259,516 | $87,232 | $172,284 |
| 2015 | $4,036 | $255,619 | $85,922 | $169,697 |
| 2014 | $3,967 | $250,612 | $84,239 | $166,373 |
Source: Public Records
Map
Nearby Homes
- 5348 Gramercy Cir
- 5311 Gramercy Cir
- 2746 Gracie Place
- 5291 Finkas Ln
- 5299 Elmquest Ct
- 2472 Shorey Way
- 2437 Sanders Ln
- 2433 Sanders Ln
- 5277 Shumway Place
- 2541 Rowe Dr
- 5206 Conley Ln
- 2326 Ray Venning Ct
- 6012 Big Sky Dr
- 2438 Sheldon Dr
- 6008 Big Sky Dr
- 6004 Big Sky Dr
- 5383 Elan Dr
- 5378 Discovery Way
- 5987 Big Sky Dr
- 5041 N Parr Ln
- 5195 Wb Goodman Ln
- 5191 W & B Goodman Ln
- 5191 Wb Goodman Ln
- 5199 Wb Goodman Ln
- 2572 Hutcheon Place
- 5198 W & B Goodman Ln
- 5198 W & B Goodman Ln Unit W
- 2552 Turri Ct
- 5186 Wb Goodman Ln
- 2576 Hutcheon Place
- 5201 Wb Goodman Ln
- 5213 Wb Goodman Ln
- 5187 Wb Goodman Ln
- 2580 Hutcheon Place
- 5217 Wb Goodman Ln
- 5205 W & B Goodman Ln
- 5221 Wb Goodman Ln
- 2548 Turri Ct
- 5205 Wb Goodman Ln