Estimated Value: $334,000 - $405,000
5
Beds
4
Baths
2,797
Sq Ft
$131/Sq Ft
Est. Value
About This Home
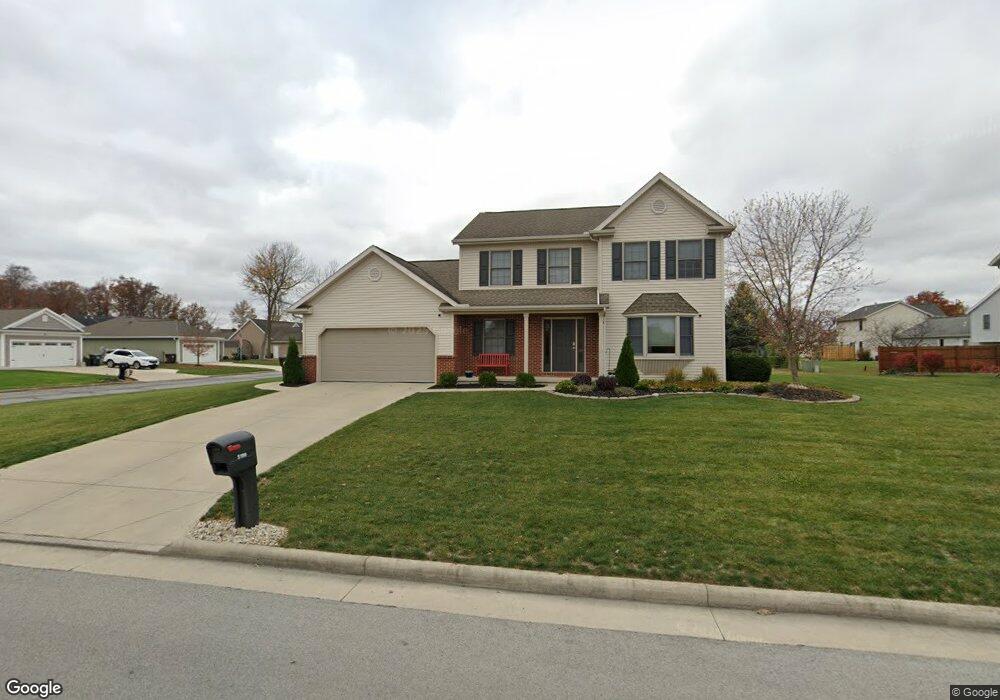
This home is located at 5199 Surrey Ln, Lima, OH 45807 and is currently estimated at $366,696, approximately $131 per square foot. 5199 Surrey Ln is a home located in Allen County with nearby schools including Elida Elementary School, Elida Middle School, and Elida High School.
Ownership History
Date
Name
Owned For
Owner Type
Purchase Details
Closed on
Apr 17, 2025
Sold by
Wright Pamela J and Osmon James C
Bought by
Osmon James C and Osmon Pamela S
Current Estimated Value
Purchase Details
Closed on
Oct 1, 2020
Sold by
Osmon James C
Bought by
Osmon James C and Wright Pamela J
Purchase Details
Closed on
Dec 17, 2018
Sold by
Osmon Angela B
Bought by
Osmon James C
Create a Home Valuation Report for This Property
The Home Valuation Report is an in-depth analysis detailing your home's value as well as a comparison with similar homes in the area
Purchase History
| Date | Buyer | Sale Price | Title Company |
|---|---|---|---|
| Osmon James C | -- | None Listed On Document | |
| Osmon James C | -- | None Available | |
| Osmon James C | -- | Pedlow Edward B | |
| Osmon James C | -- | None Available |
Source: Public Records
Tax History
| Year | Tax Paid | Tax Assessment Tax Assessment Total Assessment is a certain percentage of the fair market value that is determined by local assessors to be the total taxable value of land and additions on the property. | Land | Improvement |
|---|---|---|---|---|
| 2024 | $4,786 | $107,910 | $9,560 | $98,350 |
| 2023 | $4,289 | $86,310 | $7,630 | $78,680 |
| 2022 | $4,376 | $86,310 | $7,630 | $78,680 |
| 2021 | $4,398 | $86,310 | $7,630 | $78,680 |
| 2020 | $3,408 | $63,460 | $9,380 | $54,080 |
| 2019 | $3,408 | $63,460 | $9,380 | $54,080 |
| 2018 | $3,091 | $63,460 | $9,380 | $54,080 |
| 2017 | $2,749 | $52,640 | $9,380 | $43,260 |
| 2016 | $2,748 | $52,640 | $9,380 | $43,260 |
| 2015 | $2,711 | $52,640 | $9,380 | $43,260 |
| 2014 | $2,711 | $49,780 | $8,440 | $41,340 |
| 2013 | $2,434 | $49,780 | $8,440 | $41,340 |
Source: Public Records
Map
Nearby Homes
- 4901 Lobo St
- 4864 Pheasant St
- 2105 Dutch Hollow Rd
- 5280 Lobo St
- 5126 Pheasant St
- 1955 Dutch Hollow Rd
- 2568 Susan Ann Dr
- 5031 Daisy Ln
- 0 Alix Dr
- 2561 Baty Rd
- 2877 Whippoorwill Ave
- 0000 Baty Rd
- 4910 Amaryllis St
- 5643 Clover Ridge Dr
- 4250 Diller Rd
- 715 Wildwood Ave
- 0000 Diller Rd
- 114 Roger St
- 5924 Timberstone Dr
- 3055 Freyer Rd
Your Personal Tour Guide
Ask me questions while you tour the home.