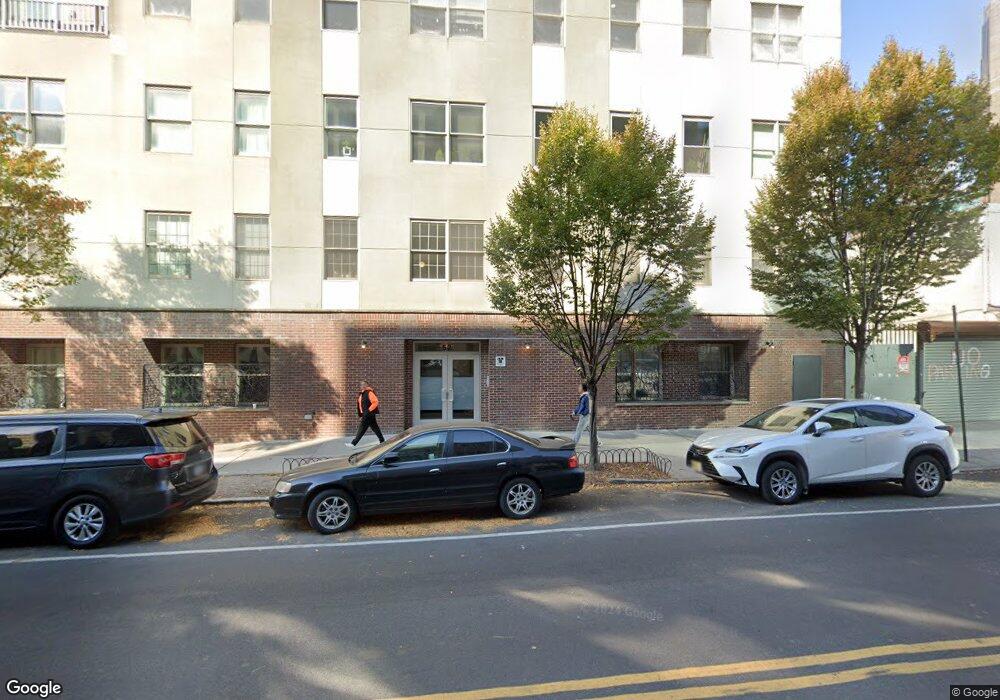
52 3 Rd Ave Unit 3-C New York City, NY 11217
Boerum Hill NeighborhoodEstimated Value: $1,269,225 - $1,713,000
--
Bed
2
Baths
1,112
Sq Ft
$1,289/Sq Ft
Est. Value
About This Home
This home is located at 52 3 Rd Ave Unit 3-C, New York City, NY 11217 and is currently estimated at $1,433,056, approximately $1,288 per square foot. 52 3 Rd Ave Unit 3-C is a home located in Kings County with nearby schools including P.S. 38 The Pacific School, A. Fantis School of Saints Constantine and Helen Cathedral, and St Joseph High School.
Ownership History
Date
Name
Owned For
Owner Type
Purchase Details
Closed on
Mar 29, 2019
Sold by
Nawaday Jaimie Leeser and Nawaday Kan
Bought by
Hu Ellen Zhao Hui and Hu Eugene Yu-Qing
Current Estimated Value
Home Financials for this Owner
Home Financials are based on the most recent Mortgage that was taken out on this home.
Original Mortgage
$726,000
Outstanding Balance
$638,283
Interest Rate
4.3%
Mortgage Type
New Conventional
Estimated Equity
$794,773
Purchase Details
Closed on
Jan 25, 2008
Sold by
Third & Atlantic Realty Associates Llc
Bought by
Nawaday Jaimie Leeser and Nawaday Kan
Home Financials for this Owner
Home Financials are based on the most recent Mortgage that was taken out on this home.
Original Mortgage
$417,000
Interest Rate
6.14%
Mortgage Type
Purchase Money Mortgage
Create a Home Valuation Report for This Property
The Home Valuation Report is an in-depth analysis detailing your home's value as well as a comparison with similar homes in the area
Home Values in the Area
Average Home Value in this Area
Purchase History
| Date | Buyer | Sale Price | Title Company |
|---|---|---|---|
| Hu Ellen Zhao Hui | $1,080,000 | -- | |
| Hu Ellen Zhao Hui | $1,080,000 | -- | |
| Nawaday Jaimie Leeser | $620,000 | -- | |
| Nawaday Jaimie Leeser | $620,000 | -- |
Source: Public Records
Mortgage History
| Date | Status | Borrower | Loan Amount |
|---|---|---|---|
| Open | Hu Ellen Zhao Hui | $726,000 | |
| Closed | Hu Ellen Zhao Hui | $726,000 | |
| Previous Owner | Nawaday Jaimie Leeser | $417,000 |
Source: Public Records
Tax History Compared to Growth
Tax History
| Year | Tax Paid | Tax Assessment Tax Assessment Total Assessment is a certain percentage of the fair market value that is determined by local assessors to be the total taxable value of land and additions on the property. | Land | Improvement |
|---|---|---|---|---|
| 2025 | $16,359 | $162,816 | $8,782 | $154,034 |
| 2024 | $16,359 | $147,039 | $8,782 | $138,257 |
| 2023 | $16,058 | $138,633 | $8,782 | $129,851 |
| 2022 | $12,574 | $134,085 | $8,782 | $125,303 |
| 2021 | $9,163 | $122,731 | $8,782 | $113,949 |
| 2020 | $3,005 | $134,148 | $8,782 | $125,366 |
| 2019 | $3,166 | $124,927 | $8,782 | $116,145 |
| 2018 | $336 | $123,139 | $8,782 | $114,357 |
| 2017 | $336 | $110,562 | $8,782 | $101,780 |
| 2016 | $340 | $110,311 | $8,782 | $101,529 |
| 2015 | $266 | $105,888 | $8,782 | $97,106 |
| 2014 | $266 | $94,597 | $8,782 | $85,815 |
Source: Public Records
Map
Nearby Homes
- 52 3rd Ave Unit 1A
- 497 Pacific St Unit 3C
- 509 Pacific St Unit 3-H
- 467 Pacific St Unit 22
- 467 Pacific St Unit 10
- 483 Atlantic Ave
- 537 Pacific St
- 457 Atlantic Ave Unit 2A
- 555 Pacific St
- 556 State St Unit 6E-S
- 556 State St Unit 3-CN
- 561 Pacific St Unit 803
- 544 Pacific St
- 560 State St Unit 9B
- 560 State St Unit 7A
- 323 Bergen St Unit 601W
- 323 Bergen St Unit PH 706 E
- 323 Bergen St Unit PH608E
- Residence 607E Plan at Bergen Hill Condos
- Residence PH701W Plan at Bergen Hill Condos
- 52 3 Rd Ave Unit 5 A
- 52 3 Rd Ave Unit 4-B
- 52 3 Rd Ave Unit 1-B
- 52 3 Rd Ave Unit 4 C
- 52 3 Rd Ave Unit 4-A
- 52 3 Rd Ave Unit 5-B
- 52 3 Rd Ave Unit 2 A
- 52 3 Rd Ave Unit B-5
- 52 3 Rd Ave Unit B-1
- 52 3 Rd Ave Unit 2-C
- 52 3 Rd Ave Unit 1 A
- 52 3rd Ave Unit 5B
- 52 3rd Ave Unit 5A
- 52 3rd Ave Unit 4C
- 52 3rd Ave Unit 4A
- 52 3rd Ave Unit 3B
- 52 3rd Ave Unit 3A
- 52 3rd Ave Unit 2C