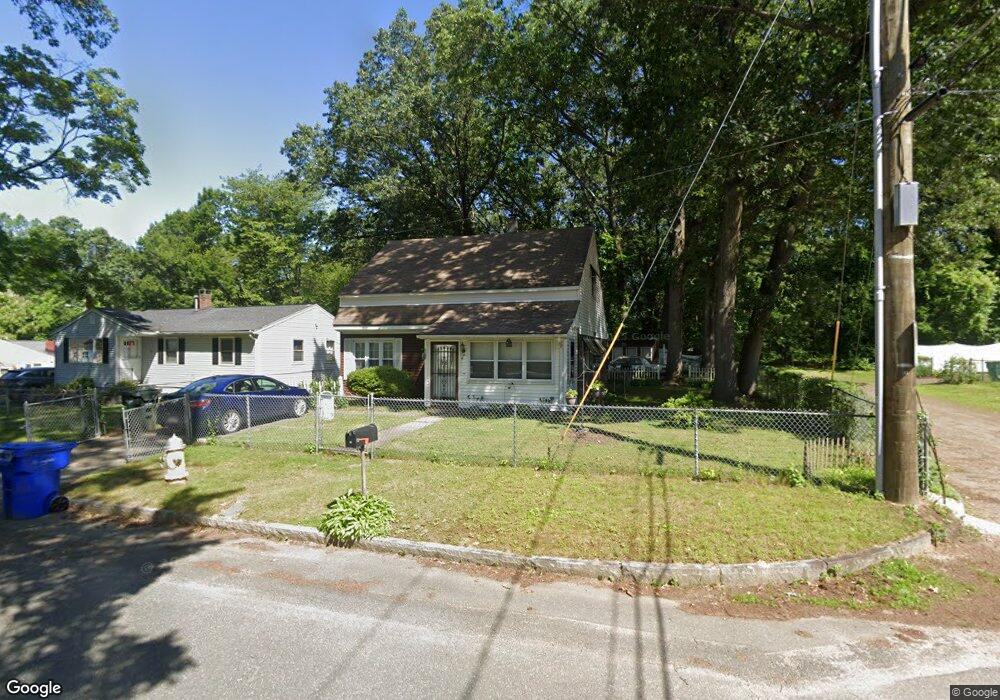
52 Bexhill St Springfield, MA 01119
Boston Road NeighborhoodEstimated Value: $200,000 - $311,000
3
Beds
1
Bath
1,920
Sq Ft
$141/Sq Ft
Est. Value
About This Home
This home is located at 52 Bexhill St, Springfield, MA 01119 and is currently estimated at $271,141, approximately $141 per square foot. 52 Bexhill St is a home located in Hampden County with nearby schools including Daniel B Brunton, John F. Kennedy Academy, and Springfield Central High School.
Ownership History
Date
Name
Owned For
Owner Type
Purchase Details
Closed on
Jul 5, 2023
Sold by
Ferenz Deborah Ann Est and Ferenz
Bought by
Ferenz Stephen M and Lafond Norman L
Current Estimated Value
Purchase Details
Closed on
Mar 10, 2021
Sold by
Ferenz Stephen M and Lafond Norman L
Bought by
Ferenz Deborah A
Purchase Details
Closed on
Feb 3, 2021
Sold by
Ferenz Deborah A Est and Ferenz
Bought by
Ferenz Stephen M
Purchase Details
Closed on
Feb 10, 2011
Sold by
Fontaine Claire E
Bought by
Springfield City Of
Purchase Details
Closed on
Jul 28, 2009
Sold by
Beecher Jane L
Bought by
Hunt Deborah
Create a Home Valuation Report for This Property
The Home Valuation Report is an in-depth analysis detailing your home's value as well as a comparison with similar homes in the area
Home Values in the Area
Average Home Value in this Area
Purchase History
| Date | Buyer | Sale Price | Title Company |
|---|---|---|---|
| Ferenz Stephen M | -- | None Available | |
| Ferenz Deborah A | -- | None Available | |
| Ferenz Stephen M | -- | None Available | |
| Springfield City Of | $1,889 | -- | |
| Hunt Deborah | $79,000 | -- |
Source: Public Records
Tax History
| Year | Tax Paid | Tax Assessment Tax Assessment Total Assessment is a certain percentage of the fair market value that is determined by local assessors to be the total taxable value of land and additions on the property. | Land | Improvement |
|---|---|---|---|---|
| 2025 | $3,269 | $208,500 | $43,000 | $165,500 |
| 2024 | $2,992 | $186,300 | $40,200 | $146,100 |
| 2023 | $2,979 | $174,700 | $38,300 | $136,400 |
| 2022 | $2,535 | $134,700 | $38,300 | $96,400 |
| 2021 | $2,601 | $137,600 | $34,800 | $102,800 |
| 2020 | $2,640 | $135,200 | $34,800 | $100,400 |
| 2019 | $2,513 | $127,700 | $34,800 | $92,900 |
| 2018 | $2,490 | $126,500 | $34,800 | $91,700 |
| 2017 | $2,546 | $129,500 | $34,800 | $94,700 |
| 2016 | $2,426 | $123,400 | $34,800 | $88,600 |
| 2015 | $2,124 | $108,000 | $34,800 | $73,200 |
Source: Public Records
Map
Nearby Homes
Your Personal Tour Guide
Ask me questions while you tour the home.