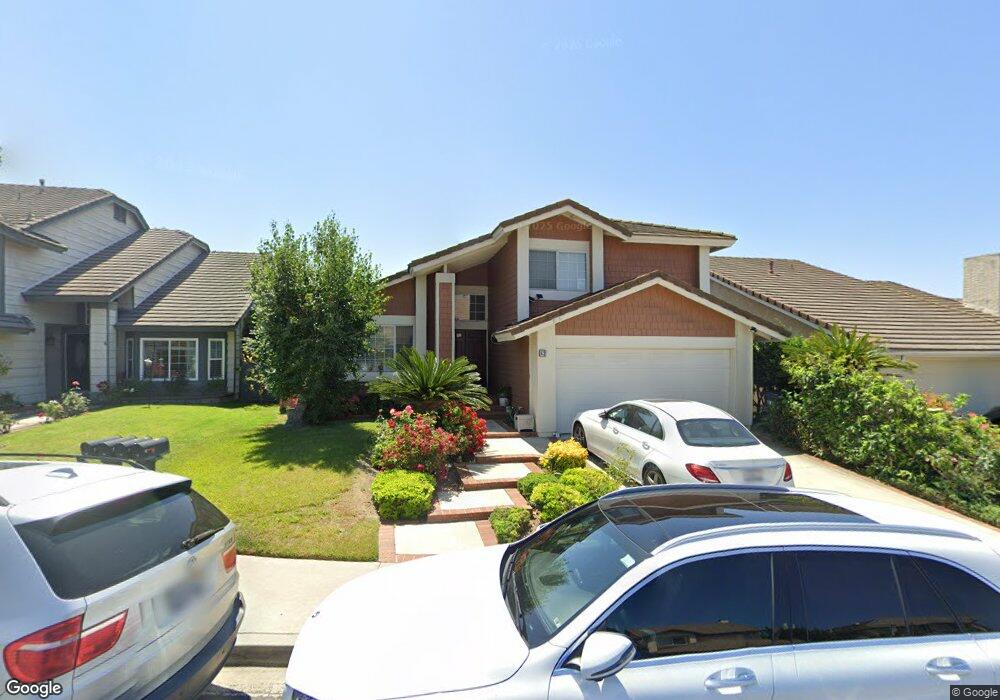
52 Fillmore Irvine, CA 92620
Northwood NeighborhoodEstimated Value: $1,754,531 - $1,853,000
4
Beds
3
Baths
2,132
Sq Ft
$843/Sq Ft
Est. Value
About This Home
This home is located at 52 Fillmore, Irvine, CA 92620 and is currently estimated at $1,797,383, approximately $843 per square foot. 52 Fillmore is a home located in Orange County with nearby schools including Brywood Elementary School, Sierra Vista Middle School, and Northwood High School.
Ownership History
Date
Name
Owned For
Owner Type
Purchase Details
Closed on
Aug 11, 2000
Sold by
Joseph Marquez Ray and Joseph Judy A C
Bought by
Kim Hunsu and Kim Youngnam
Current Estimated Value
Home Financials for this Owner
Home Financials are based on the most recent Mortgage that was taken out on this home.
Original Mortgage
$413,500
Outstanding Balance
$148,766
Interest Rate
8.11%
Mortgage Type
Stand Alone First
Estimated Equity
$1,648,617
Create a Home Valuation Report for This Property
The Home Valuation Report is an in-depth analysis detailing your home's value as well as a comparison with similar homes in the area
Home Values in the Area
Average Home Value in this Area
Purchase History
| Date | Buyer | Sale Price | Title Company |
|---|---|---|---|
| Kim Hunsu | $413,500 | -- |
Source: Public Records
Mortgage History
| Date | Status | Borrower | Loan Amount |
|---|---|---|---|
| Open | Kim Hunsu | $413,500 |
Source: Public Records
Tax History
| Year | Tax Paid | Tax Assessment Tax Assessment Total Assessment is a certain percentage of the fair market value that is determined by local assessors to be the total taxable value of land and additions on the property. | Land | Improvement |
|---|---|---|---|---|
| 2025 | $6,577 | $623,074 | $392,267 | $230,807 |
| 2024 | $6,577 | $610,857 | $384,575 | $226,282 |
| 2023 | $6,406 | $598,880 | $377,034 | $221,846 |
| 2022 | $6,282 | $587,138 | $369,641 | $217,497 |
| 2021 | $6,137 | $575,626 | $362,393 | $213,233 |
| 2020 | $6,101 | $569,724 | $358,677 | $211,047 |
| 2019 | $5,965 | $558,553 | $351,644 | $206,909 |
| 2018 | $5,858 | $547,601 | $344,749 | $202,852 |
| 2017 | $5,736 | $536,864 | $337,989 | $198,875 |
| 2016 | $5,484 | $526,338 | $331,362 | $194,976 |
| 2015 | $5,402 | $518,432 | $326,384 | $192,048 |
| 2014 | $5,297 | $508,277 | $319,990 | $188,287 |
Source: Public Records
Map
Nearby Homes
- 30 Jefferson
- 6 Gettysburg
- 66 Bridgeport
- 4 Carson
- 4062 Escudero Dr
- 22 Yorktown
- 4061 Salacia Dr
- 92 New Season Unit 70
- 14232 Matisse Ave
- 65 Remington Unit 232
- 73 Huntington Unit 322
- 14072 Picasso Ct
- 83 Huntington Unit 278
- 127 Huntington Unit 257
- 18 Harrisburg
- 14272 Saarinen Ct
- 26 Helena Unit 69
- 22 Hunter
- 10 Santa fe Unit 38
- 7 Chattanooga
Your Personal Tour Guide
Ask me questions while you tour the home.