Estimated Value: $602,000 - $729,000
3
Beds
4
Baths
2,281
Sq Ft
$289/Sq Ft
Est. Value
About This Home
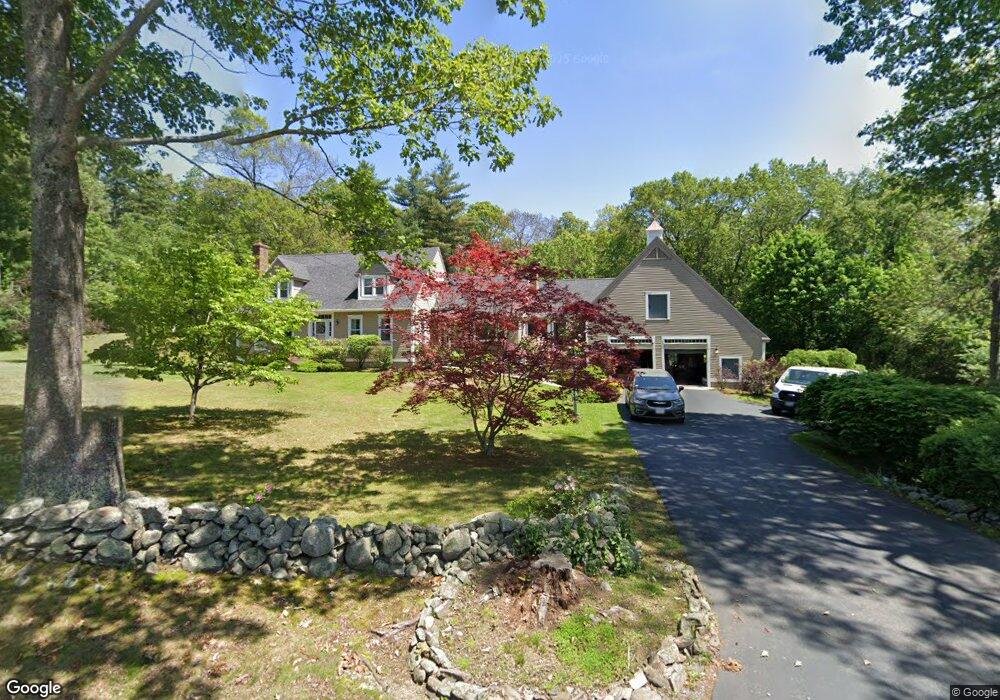
This home is located at 52 Floyd Rd, Derry, NH 03038 and is currently estimated at $659,827, approximately $289 per square foot. 52 Floyd Rd is a home located in Rockingham County with nearby schools including Derry Village School, West Running Brook Middle School, and Pinkerton Academy.
Ownership History
Date
Name
Owned For
Owner Type
Purchase Details
Closed on
Dec 23, 2016
Sold by
Giles Robert C and Giles Bernadette
Bought by
Giles Ft
Current Estimated Value
Purchase Details
Closed on
Oct 29, 1999
Sold by
Mitchell Fam Ret
Bought by
Giles Robert C and Giles Bernadette
Home Financials for this Owner
Home Financials are based on the most recent Mortgage that was taken out on this home.
Original Mortgage
$200,000
Interest Rate
7.78%
Create a Home Valuation Report for This Property
The Home Valuation Report is an in-depth analysis detailing your home's value as well as a comparison with similar homes in the area
Home Values in the Area
Average Home Value in this Area
Purchase History
| Date | Buyer | Sale Price | Title Company |
|---|---|---|---|
| Giles Ft | -- | -- | |
| Giles Robert C | $260,000 | -- |
Source: Public Records
Mortgage History
| Date | Status | Borrower | Loan Amount |
|---|---|---|---|
| Previous Owner | Giles Robert C | $25,000 | |
| Previous Owner | Giles Robert C | $280,000 | |
| Previous Owner | Giles Robert C | $200,000 |
Source: Public Records
Tax History
| Year | Tax Paid | Tax Assessment Tax Assessment Total Assessment is a certain percentage of the fair market value that is determined by local assessors to be the total taxable value of land and additions on the property. | Land | Improvement |
|---|---|---|---|---|
| 2025 | $12,116 | $638,000 | $203,800 | $434,200 |
| 2024 | $11,924 | $638,000 | $203,800 | $434,200 |
| 2023 | $11,796 | $570,400 | $173,200 | $397,200 |
| 2022 | $10,860 | $570,400 | $173,200 | $397,200 |
| 2021 | $10,258 | $414,300 | $133,100 | $281,200 |
| 2020 | $10,084 | $414,300 | $133,100 | $281,200 |
| 2019 | $10,320 | $395,100 | $103,500 | $291,600 |
| 2018 | $10,558 | $395,100 | $103,500 | $291,600 |
| 2017 | $8,847 | $345,600 | $98,500 | $247,100 |
| 2016 | $8,805 | $325,400 | $98,500 | $226,900 |
| 2015 | $8,722 | $298,400 | $98,500 | $199,900 |
| 2014 | $8,779 | $298,400 | $98,500 | $199,900 |
| 2013 | $9,365 | $297,400 | $90,500 | $206,900 |
Source: Public Records
Map
Nearby Homes
- 89 Lane Rd
- 5 Stone Fence Dr
- 139 Rockingham Rd Unit 21
- 144 Rockingham Rd
- 15 Bonnie Ln Unit R
- 21 Berry Rd
- 5 Craven Terrace
- 4C Pine Isle Dr Unit B
- 13 Sunnyside Ln Unit L
- 47 Drew Woods Dr
- 4 Westview Dr
- 7 Chester Rd Unit 212
- 13 Kilrea Rd Unit L
- 3 Pine Bluff
- 32 Chester Rd
- 211 Hampstead Rd
- 5 Nesmith St
- 4 Pembroke Dr Unit 22
- 12 Halls Village Rd
- 8 Blueberry Rd Unit U: R
Your Personal Tour Guide
Ask me questions while you tour the home.