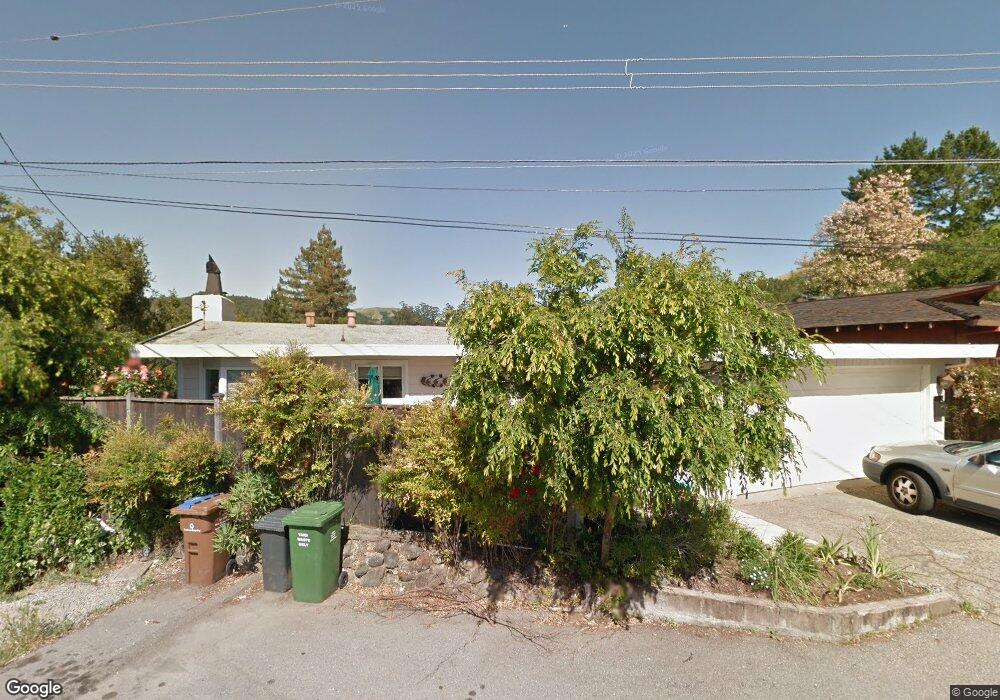
52 Hillcrest Ct San Anselmo, CA 94960
Estimated Value: $1,245,000 - $1,538,000
5
Beds
3
Baths
2,092
Sq Ft
$675/Sq Ft
Est. Value
About This Home
This home is located at 52 Hillcrest Ct, San Anselmo, CA 94960 and is currently estimated at $1,412,923, approximately $675 per square foot. 52 Hillcrest Ct is a home located in Marin County with nearby schools including Brookside Elementary School, White Hill Middle School, and Archie Williams High School.
Ownership History
Date
Name
Owned For
Owner Type
Purchase Details
Closed on
Jul 13, 2011
Sold by
Schaal Thomas E
Bought by
Mueller Hans J and Mueller Kari E
Current Estimated Value
Purchase Details
Closed on
May 30, 2003
Sold by
Schaal Thomas E and Mueller Hans J
Bought by
Schaal Thomas E
Home Financials for this Owner
Home Financials are based on the most recent Mortgage that was taken out on this home.
Original Mortgage
$500,000
Outstanding Balance
$216,320
Interest Rate
5.61%
Mortgage Type
Credit Line Revolving
Estimated Equity
$1,196,603
Purchase Details
Closed on
Aug 17, 1995
Sold by
Mueller Hans J and Mueller Kari E
Bought by
Schaal Thomas E and Mueller Hans J
Purchase Details
Closed on
Jan 11, 1994
Sold by
Mueller Hans Jo and Mueller Kari E
Bought by
Mueller Hans J and Mueller Kari E
Create a Home Valuation Report for This Property
The Home Valuation Report is an in-depth analysis detailing your home's value as well as a comparison with similar homes in the area
Home Values in the Area
Average Home Value in this Area
Purchase History
| Date | Buyer | Sale Price | Title Company |
|---|---|---|---|
| Mueller Hans J | -- | None Available | |
| Schaal Thomas E | -- | First American Title | |
| Schaal Thomas E | -- | -- | |
| Mueller Hans J | -- | -- |
Source: Public Records
Mortgage History
| Date | Status | Borrower | Loan Amount |
|---|---|---|---|
| Open | Schaal Thomas E | $500,000 |
Source: Public Records
Tax History
| Year | Tax Paid | Tax Assessment Tax Assessment Total Assessment is a certain percentage of the fair market value that is determined by local assessors to be the total taxable value of land and additions on the property. | Land | Improvement |
|---|---|---|---|---|
| 2025 | $3,526 | $134,826 | $39,832 | $94,994 |
| 2024 | $3,412 | $132,183 | $39,051 | $93,132 |
| 2023 | $3,368 | $129,591 | $38,285 | $91,306 |
| 2022 | $3,282 | $127,051 | $37,535 | $89,516 |
| 2021 | $3,184 | $124,560 | $36,799 | $87,761 |
| 2020 | $3,108 | $123,283 | $36,422 | $86,861 |
| 2019 | $2,805 | $120,865 | $35,707 | $85,158 |
| 2018 | $2,730 | $118,496 | $35,007 | $83,489 |
| 2017 | $2,642 | $116,173 | $34,321 | $81,852 |
| 2016 | $2,500 | $113,895 | $33,648 | $80,247 |
| 2015 | $2,439 | $112,185 | $33,143 | $79,042 |
| 2014 | $2,301 | $109,988 | $32,494 | $77,494 |
Source: Public Records
Map
Nearby Homes
- 50 Hillcrest Ct
- 26 Hawthorne Ave
- 0 Valley Rd Unit 325089584
- 148 Ridgeway Ave
- 58 Berkeley Ave
- 2 Florence Ave
- 2 Baytree Ln
- 1508 San Anselmo Ave
- 327 Butterfield Rd
- 103 Holstein Rd
- 0 Holstein Rd
- 118 Marinda Dr
- 405 Scenic Ave
- 418 Scenic Ave
- 41 Salinas Ave
- 55 Park Rd
- 480 Scenic Ave
- 51 Berry Trail
- 33 Fawn Dr
- 223 Tamalpais Rd
Your Personal Tour Guide
Ask me questions while you tour the home.