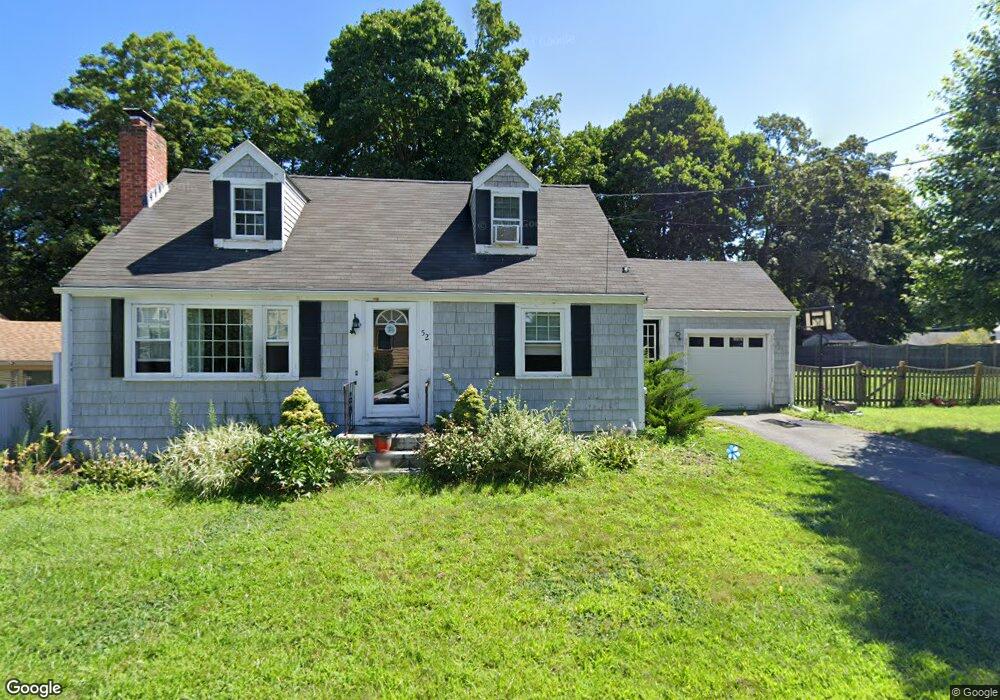
52 Mason St Hudson, MA 01749
Estimated Value: $500,000 - $718,000
3
Beds
1
Bath
1,280
Sq Ft
$446/Sq Ft
Est. Value
About This Home
This home is located at 52 Mason St, Hudson, MA 01749 and is currently estimated at $570,318, approximately $445 per square foot. 52 Mason St is a home located in Middlesex County with nearby schools including David J. Quinn Middle School, Hudson High School, and First Steps Children's Center.
Ownership History
Date
Name
Owned For
Owner Type
Purchase Details
Closed on
Jun 24, 2011
Sold by
Warner Daniel G and Warner Beth E
Bought by
Martins Ludmulle and Martins Danielle
Current Estimated Value
Home Financials for this Owner
Home Financials are based on the most recent Mortgage that was taken out on this home.
Original Mortgage
$220,000
Outstanding Balance
$151,663
Interest Rate
4.63%
Mortgage Type
Purchase Money Mortgage
Estimated Equity
$418,655
Purchase Details
Closed on
Jun 1, 2004
Sold by
Lafleur Edward P
Bought by
Warner Beth E and Warner Daniel G
Home Financials for this Owner
Home Financials are based on the most recent Mortgage that was taken out on this home.
Original Mortgage
$150,000
Interest Rate
5.88%
Mortgage Type
Purchase Money Mortgage
Create a Home Valuation Report for This Property
The Home Valuation Report is an in-depth analysis detailing your home's value as well as a comparison with similar homes in the area
Home Values in the Area
Average Home Value in this Area
Purchase History
| Date | Buyer | Sale Price | Title Company |
|---|---|---|---|
| Martins Ludmulle | $245,000 | -- | |
| Martins Ludmulle | $245,000 | -- | |
| Warner Beth E | $150,000 | -- | |
| Warner Beth E | $150,000 | -- |
Source: Public Records
Mortgage History
| Date | Status | Borrower | Loan Amount |
|---|---|---|---|
| Open | Martins Ludmulle | $220,000 | |
| Closed | Warner Beth E | $220,000 | |
| Previous Owner | Warner Beth E | $150,000 | |
| Previous Owner | Warner Beth E | $60,000 |
Source: Public Records
Tax History
| Year | Tax Paid | Tax Assessment Tax Assessment Total Assessment is a certain percentage of the fair market value that is determined by local assessors to be the total taxable value of land and additions on the property. | Land | Improvement |
|---|---|---|---|---|
| 2025 | $6,407 | $461,600 | $158,500 | $303,100 |
| 2024 | $6,139 | $438,500 | $144,100 | $294,400 |
| 2023 | $5,690 | $389,700 | $138,700 | $251,000 |
| 2022 | $5,085 | $320,600 | $126,000 | $194,600 |
| 2021 | $5,032 | $303,300 | $120,000 | $183,300 |
| 2020 | $32,624 | $300,900 | $117,600 | $183,300 |
| 2019 | $7,754 | $275,700 | $117,600 | $158,100 |
| 2018 | $8,783 | $258,900 | $112,100 | $146,800 |
| 2017 | $4,216 | $240,900 | $106,700 | $134,200 |
| 2016 | $3,925 | $227,000 | $106,700 | $120,300 |
| 2015 | $3,641 | $210,800 | $106,700 | $104,100 |
| 2014 | $3,536 | $203,000 | $93,500 | $109,500 |
Source: Public Records
Map
Nearby Homes
- 41 Walnut St
- 16 Houghton St
- 17 School St Unit C
- 17 School St Unit A
- 11 Barracks Rd Unit 11
- 32 Barracks Rd Unit 32
- 9 Barracks Rd Unit 9
- 4 Barracks Rd Unit 4
- 3 Barracks Rd Unit 3
- 7 Barracks Rd Unit 7
- 5 Barracks Rd Unit 5
- 13 Barracks Rd Unit 13
- 10 Barracks Rd Unit 10
- 56 Park St
- 65 Main St
- 16 Barnes Blvd Unit 16
- 34 Forest Ave
- 248 Main St Unit 207
- 248 Main St Unit 210
- 243 Washington St