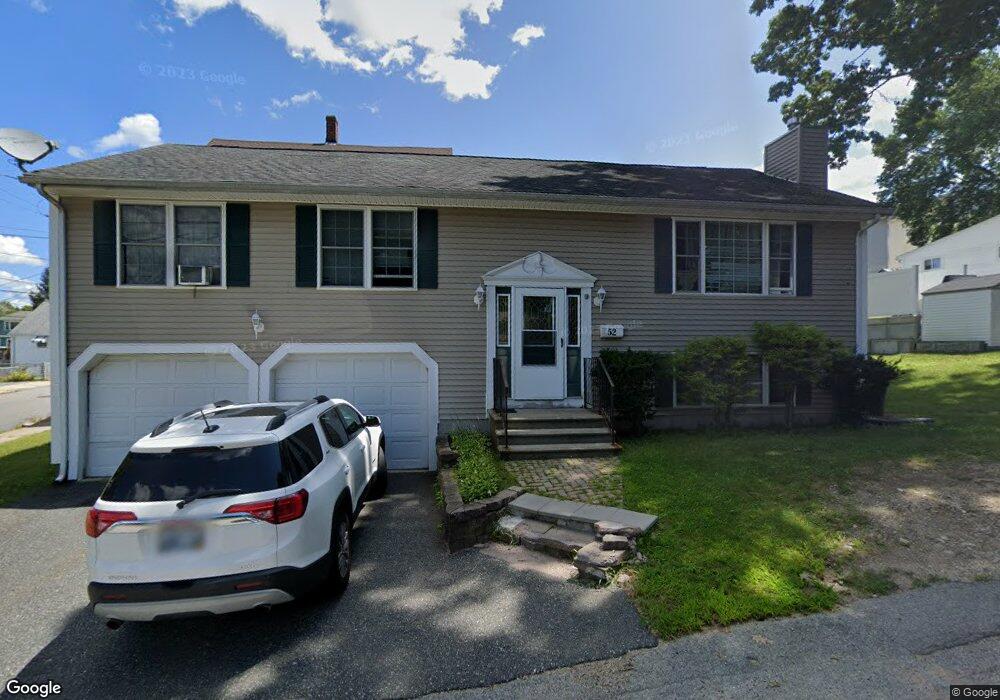
52 Minerva St Woonsocket, RI 02895
Globe District NeighborhoodEstimated Value: $385,000 - $417,650
3
Beds
2
Baths
1,932
Sq Ft
$205/Sq Ft
Est. Value
About This Home
This home is located at 52 Minerva St, Woonsocket, RI 02895 and is currently estimated at $395,663, approximately $204 per square foot. 52 Minerva St is a home located in Providence County with nearby schools including Woonsocket High School, Founders Academy, and Beacon Charter School.
Ownership History
Date
Name
Owned For
Owner Type
Purchase Details
Closed on
Aug 12, 2025
Sold by
Njie-Faye Amie
Bought by
Faye Halifa and Njie-Faye Amie
Current Estimated Value
Purchase Details
Closed on
Nov 21, 2005
Sold by
Foisy Steven and Jarrie Elaine A
Bought by
Njie-Faye Amie
Home Financials for this Owner
Home Financials are based on the most recent Mortgage that was taken out on this home.
Original Mortgage
$197,600
Interest Rate
6.07%
Mortgage Type
Purchase Money Mortgage
Purchase Details
Closed on
Jun 6, 2002
Sold by
Recore Raymond G
Bought by
Jarrie Elaine A
Create a Home Valuation Report for This Property
The Home Valuation Report is an in-depth analysis detailing your home's value as well as a comparison with similar homes in the area
Home Values in the Area
Average Home Value in this Area
Purchase History
| Date | Buyer | Sale Price | Title Company |
|---|---|---|---|
| Faye Halifa | -- | -- | |
| Faye Halifa | -- | -- | |
| Njie-Faye Amie | $247,000 | -- | |
| Jarrie Elaine A | $173,000 | -- | |
| Njie-Faye Amie | $247,000 | -- | |
| Jarrie Elaine A | $173,000 | -- |
Source: Public Records
Mortgage History
| Date | Status | Borrower | Loan Amount |
|---|---|---|---|
| Previous Owner | Jarrie Elaine A | $253,000 | |
| Previous Owner | Jarrie Elaine A | $197,600 | |
| Previous Owner | Jarrie Elaine A | $49,400 |
Source: Public Records
Tax History
| Year | Tax Paid | Tax Assessment Tax Assessment Total Assessment is a certain percentage of the fair market value that is determined by local assessors to be the total taxable value of land and additions on the property. | Land | Improvement |
|---|---|---|---|---|
| 2025 | $4,456 | $396,800 | $94,200 | $302,600 |
| 2024 | $4,824 | $331,800 | $89,500 | $242,300 |
| 2023 | $4,639 | $331,800 | $89,500 | $242,300 |
| 2022 | $4,639 | $331,800 | $89,500 | $242,300 |
| 2021 | $5,002 | $210,600 | $57,800 | $152,800 |
| 2020 | $5,054 | $210,600 | $57,800 | $152,800 |
| 2018 | $5,071 | $210,600 | $57,800 | $152,800 |
| 2017 | $5,605 | $186,200 | $52,600 | $133,600 |
| 2016 | $5,929 | $186,200 | $52,600 | $133,600 |
| 2015 | $6,811 | $186,200 | $52,600 | $133,600 |
| 2014 | $6,318 | $175,800 | $57,900 | $117,900 |
Source: Public Records
Map
Nearby Homes
- 202 Jenckes St
- 1 Admiral St
- 1060 Park Ave
- 80 Summit St
- 604 Providence St
- 122 Grand St
- 25 Ormond St
- 182 Avenue C Unit 6
- 184 Avenue C Unit 2
- 184 Avenue C Unit 5
- 184 Avenue C Unit 6
- 184 Avenue C Unit 3
- 184 Avenue C Unit 1
- 184 Avenue C Unit 4
- 190 Coe St
- 147 Warwick St
- 109 Hemond Ave
- 15 Knight St
- 63 Capwell Ave
- 59 Cooper Ave
- 475 Ballou St
- 485 Ballou St
- 57 Minerva St
- 72 Minerva St
- 271 Ward St
- 495 Ballou St
- 476 Ballou St
- 472 Ballou St
- 351 Transit St
- 277 Ward St
- 118 Darwin St
- 0 Minerva St Unit 623592
- 0 Minerva St Unit 200926
- 0 Minerva St Unit 1274160
- 0 Minerva St Unit 1289661
- 90 Minerva St
- 427 Ballou St
- 227 Ward St
- 438 Ballou St
- 112 Darwin St
Your Personal Tour Guide
Ask me questions while you tour the home.