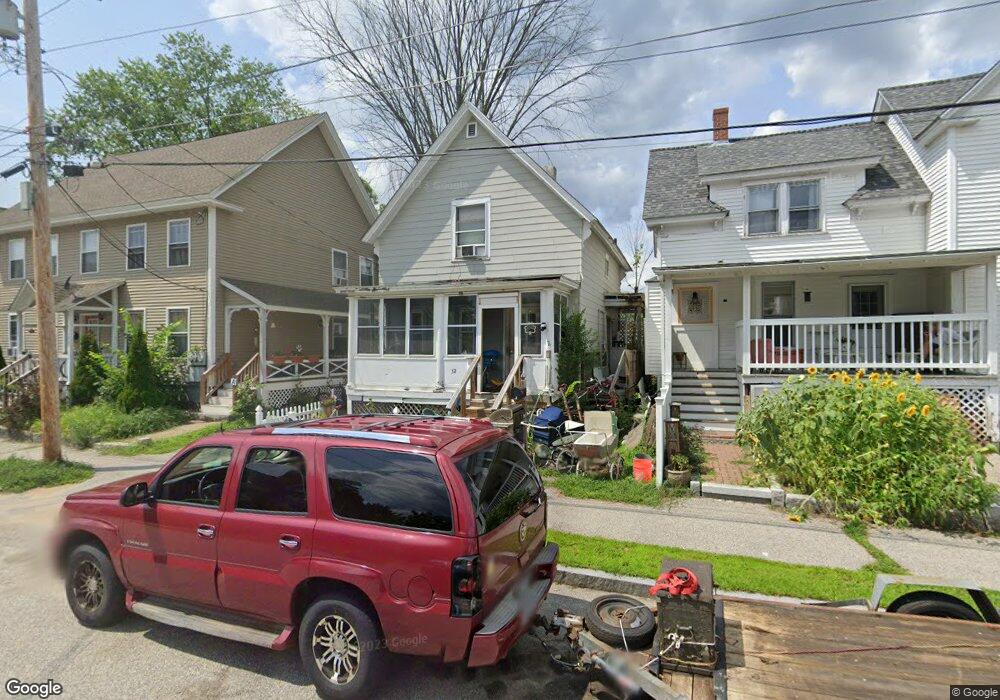
52 Perley St Concord, NH 03301
South End NeighborhoodEstimated Value: $279,000 - $420,000
3
Beds
1
Bath
832
Sq Ft
$417/Sq Ft
Est. Value
About This Home
This home is located at 52 Perley St, Concord, NH 03301 and is currently estimated at $346,990, approximately $417 per square foot. 52 Perley St is a home located in Merrimack County with nearby schools including Christa McAuliffe School, Rundlett Middle School, and Concord High School.
Ownership History
Date
Name
Owned For
Owner Type
Purchase Details
Closed on
Apr 14, 2017
Sold by
Blackler Roberta L
Bought by
Warren Barbara
Current Estimated Value
Home Financials for this Owner
Home Financials are based on the most recent Mortgage that was taken out on this home.
Original Mortgage
$108,007
Outstanding Balance
$89,606
Interest Rate
4.1%
Mortgage Type
FHA
Estimated Equity
$257,384
Purchase Details
Closed on
May 19, 1998
Sold by
Young Joan M and Young Robert J
Bought by
Blackler Roberta L
Home Financials for this Owner
Home Financials are based on the most recent Mortgage that was taken out on this home.
Original Mortgage
$28,000
Interest Rate
7.08%
Mortgage Type
Purchase Money Mortgage
Create a Home Valuation Report for This Property
The Home Valuation Report is an in-depth analysis detailing your home's value as well as a comparison with similar homes in the area
Home Values in the Area
Average Home Value in this Area
Purchase History
| Date | Buyer | Sale Price | Title Company |
|---|---|---|---|
| Warren Barbara | $110,000 | -- | |
| Blackler Roberta L | $40,000 | -- |
Source: Public Records
Mortgage History
| Date | Status | Borrower | Loan Amount |
|---|---|---|---|
| Open | Warren Barbara | $108,007 | |
| Previous Owner | Blackler Roberta L | $32,000 | |
| Previous Owner | Blackler Roberta L | $42,000 | |
| Previous Owner | Blackler Roberta L | $28,000 |
Source: Public Records
Tax History Compared to Growth
Tax History
| Year | Tax Paid | Tax Assessment Tax Assessment Total Assessment is a certain percentage of the fair market value that is determined by local assessors to be the total taxable value of land and additions on the property. | Land | Improvement |
|---|---|---|---|---|
| 2024 | $3,893 | $140,600 | $53,000 | $87,600 |
| 2023 | $3,777 | $140,600 | $53,000 | $87,600 |
| 2022 | $3,640 | $140,600 | $53,000 | $87,600 |
| 2021 | $3,916 | $155,900 | $53,000 | $102,900 |
| 2020 | $3,532 | $132,000 | $42,300 | $89,700 |
| 2019 | $3,172 | $114,200 | $39,300 | $74,900 |
| 2018 | $3,138 | $111,300 | $39,300 | $72,000 |
| 2017 | $2,993 | $106,000 | $39,300 | $66,700 |
| 2016 | $2,382 | $86,100 | $35,300 | $50,800 |
| 2015 | $2,247 | $82,200 | $34,600 | $47,600 |
| 2014 | $2,204 | $82,200 | $34,600 | $47,600 |
| 2013 | $2,087 | $81,600 | $34,600 | $47,000 |
| 2012 | $1,984 | $81,400 | $34,600 | $46,800 |
Source: Public Records
Map
Nearby Homes
- 47 South St
- 14 Downing St
- 14-16 Perley St
- 0 Spruce St Unit 88
- 10 Perley St
- 33 Spruce St
- 12 Avon St
- 24 Badger St
- 87 S Main St Unit 2
- 4 Fayette St
- 54 Pleasant St Unit 8
- 122 South St
- 105 S Main St
- 0 South St Unit 4969509
- 17 Essex St
- 2 Kensington Rd
- 1 Kensington Rd
- 22 Wilson Ave
- 15 Wilson Ave
- 30 Jackson St
- 26 Pierce St
- 54 Perley St
- 24 Pierce St
- 22 Pierce St
- 28 Pierce St
- 57 Perley St
- 55 Perley St
- 48 Perley St Unit 50
- 30 Pierce St
- 20 Pierce St
- 59 Perley St
- 69-71 Perley St
- 15 Pierce St
- 37 Laurel St
- 11&15 Pierce St
- 39 Laurel St
- 47 Perley St Unit 49.5 Perley Street
- 46 Perley St
- 16 Pierce St Unit 18
- 41 Laurel St Unit 43