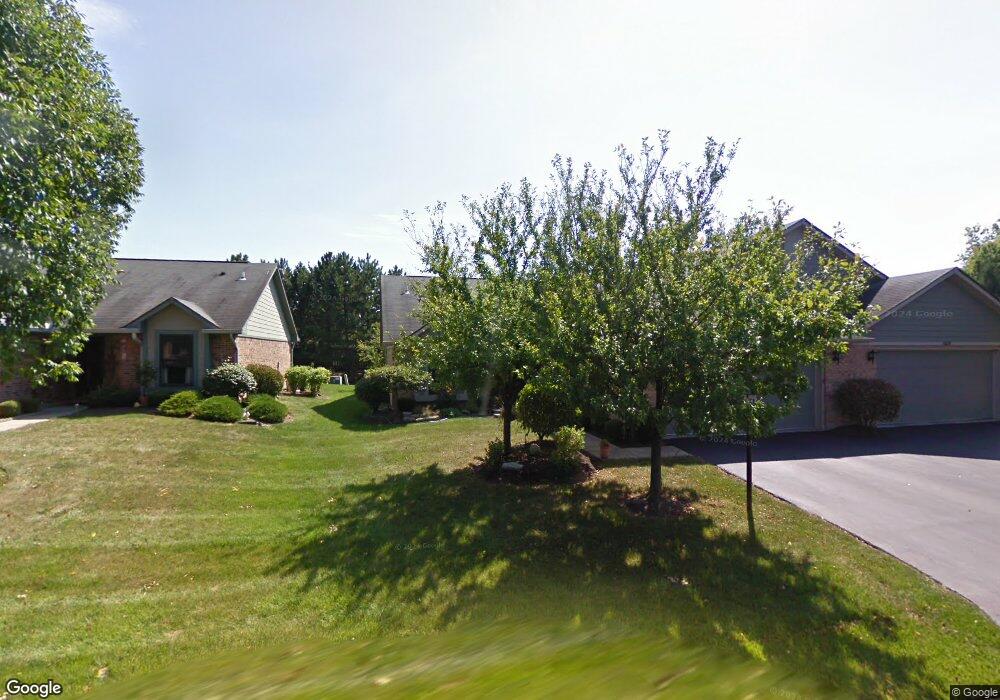
52 Shaker Run Rd Lebanon, OH 45036
Estimated Value: $303,358 - $333,000
3
Beds
2
Baths
1,496
Sq Ft
$209/Sq Ft
Est. Value
About This Home
This home is located at 52 Shaker Run Rd, Lebanon, OH 45036 and is currently estimated at $312,340, approximately $208 per square foot. 52 Shaker Run Rd is a home located in Warren County with nearby schools including Bowman Primary School, Berry Intermediate School, and Donovan Elementary School.
Ownership History
Date
Name
Owned For
Owner Type
Purchase Details
Closed on
Jun 14, 2021
Sold by
Tompkins Jeri and Estate Of Christina Rosa Hanse
Bought by
Bergman Delores
Current Estimated Value
Purchase Details
Closed on
Dec 31, 2004
Sold by
Rittgers Charles H and Rittgers Ellen B
Bought by
Hansen Christy R
Home Financials for this Owner
Home Financials are based on the most recent Mortgage that was taken out on this home.
Original Mortgage
$130,400
Interest Rate
5.78%
Mortgage Type
Purchase Money Mortgage
Purchase Details
Closed on
Jul 31, 2002
Sold by
Rittgers Perry
Bought by
Rittgers Charles H and Rittgers Ellen B
Purchase Details
Closed on
Sep 7, 1995
Sold by
Oberer Dev Co
Bought by
Rittgers Perry J
Purchase Details
Closed on
May 27, 1993
Sold by
Oberer Development Co
Bought by
Oberer Development Co.
Create a Home Valuation Report for This Property
The Home Valuation Report is an in-depth analysis detailing your home's value as well as a comparison with similar homes in the area
Home Values in the Area
Average Home Value in this Area
Purchase History
| Date | Buyer | Sale Price | Title Company |
|---|---|---|---|
| Bergman Delores | $220,000 | None Listed On Document | |
| Hansen Christy R | $163,000 | Chicago Title Insurance Co | |
| Rittgers Charles H | $130,000 | -- | |
| Rittgers Perry J | $115,935 | -- | |
| Oberer Development Co. | -- | -- |
Source: Public Records
Mortgage History
| Date | Status | Borrower | Loan Amount |
|---|---|---|---|
| Previous Owner | Hansen Christy R | $130,400 |
Source: Public Records
Tax History Compared to Growth
Tax History
| Year | Tax Paid | Tax Assessment Tax Assessment Total Assessment is a certain percentage of the fair market value that is determined by local assessors to be the total taxable value of land and additions on the property. | Land | Improvement |
|---|---|---|---|---|
| 2024 | $3,518 | $84,720 | $19,250 | $65,470 |
| 2023 | $3,184 | $68,901 | $10,762 | $58,138 |
| 2022 | $3,319 | $68,901 | $10,763 | $58,139 |
| 2021 | $2,739 | $68,901 | $10,763 | $58,139 |
| 2020 | $2,548 | $56,018 | $8,750 | $47,268 |
| 2019 | $2,560 | $56,018 | $8,750 | $47,268 |
| 2018 | $2,194 | $56,018 | $8,750 | $47,268 |
| 2017 | $2,153 | $50,362 | $8,092 | $42,270 |
| 2016 | $2,221 | $50,362 | $8,092 | $42,270 |
| 2015 | $2,237 | $50,362 | $8,092 | $42,270 |
| 2014 | $2,145 | $47,070 | $7,560 | $39,500 |
| 2013 | $2,063 | $54,450 | $8,750 | $45,700 |
Source: Public Records
Map
Nearby Homes
- 39 Shaker Run Rd
- 39 Shaker Run Rd
- 52 Shaker Run Rd
- 52 Shaker Run Rd Unit B
- 39 Shaker Run Rd Unit A
- 52 Shaker Run Rd Unit 4395-5
- 51 Shaker Run Rd
- 51 Shaker Run Rd
- 51 Shaker Run Rd Unit A
- 51 Shaker Run Rd Unit B
- 51 Shaker Run Rd Unit 4395-5
- 9 Spring Blossom Dr
- 8 Springblossom Dr
- 38 Shaker Run Rd
- 38 Shaker Run Rd
- 38 Shaker Run Rd Unit B
- 38 Shaker Run Rd Unit 4395-3
- 40 Springhouse Ct
- 40 Springhouse Ct
- 40 Springhouse Ct Unit B