Estimated Value: $314,036 - $354,000
4
Beds
2
Baths
1,756
Sq Ft
$191/Sq Ft
Est. Value
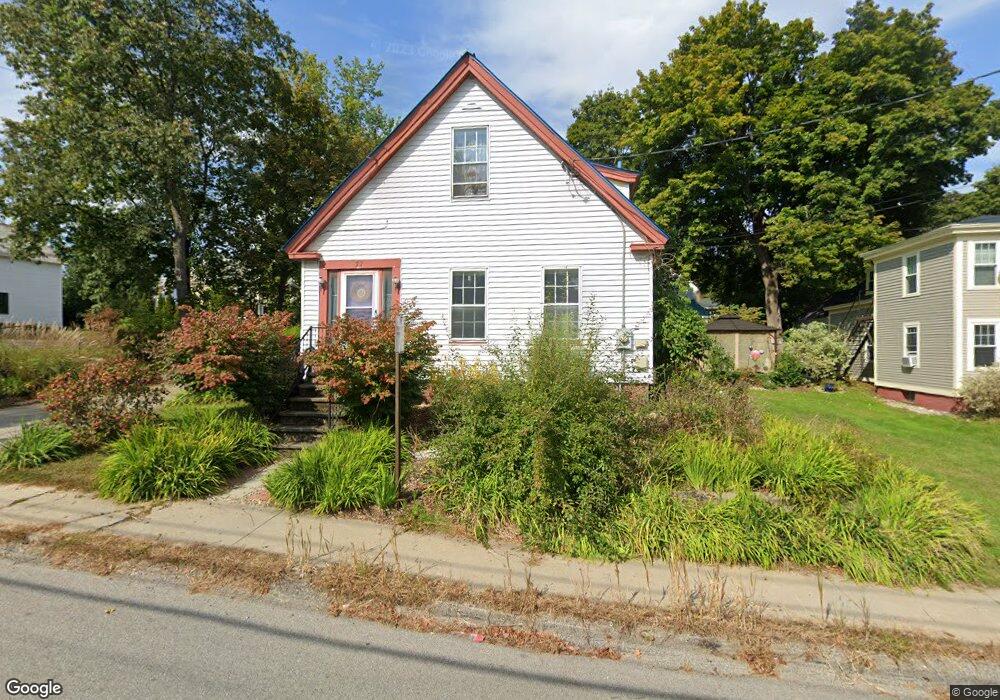
About This Home
This home is located at 52 Spring St, Keene, NH 03431 and is currently estimated at $335,759, approximately $191 per square foot. 52 Spring St is a home located in Cheshire County with nearby schools including Franklin Elementary School, Keene High School, and Gathering Waters Charter School (E).
Ownership History
Date
Name
Owned For
Owner Type
Purchase Details
Closed on
Jan 31, 2022
Sold by
Johnson John A and Johnson Lisa D
Bought by
John & Lisa Johnson Ret
Current Estimated Value
Purchase Details
Closed on
Jul 20, 2006
Sold by
Smith Ruth E
Bought by
Johnson John A
Home Financials for this Owner
Home Financials are based on the most recent Mortgage that was taken out on this home.
Original Mortgage
$171,650
Interest Rate
6.67%
Mortgage Type
Purchase Money Mortgage
Create a Home Valuation Report for This Property
The Home Valuation Report is an in-depth analysis detailing your home's value as well as a comparison with similar homes in the area
Purchase History
| Date | Buyer | Sale Price | Title Company |
|---|---|---|---|
| John & Lisa Johnson Ret | -- | None Available | |
| Johnson John A | $175,000 | -- |
Source: Public Records
Mortgage History
| Date | Status | Borrower | Loan Amount |
|---|---|---|---|
| Previous Owner | Johnson John A | $152,555 | |
| Previous Owner | Johnson John A | $171,650 |
Source: Public Records
Tax History Compared to Growth
Tax History
| Year | Tax Paid | Tax Assessment Tax Assessment Total Assessment is a certain percentage of the fair market value that is determined by local assessors to be the total taxable value of land and additions on the property. | Land | Improvement |
|---|---|---|---|---|
| 2024 | $6,779 | $205,000 | $37,900 | $167,100 |
| 2023 | $6,537 | $205,000 | $37,900 | $167,100 |
| 2022 | $5,688 | $183,300 | $37,900 | $145,400 |
| 2021 | $5,734 | $183,300 | $37,900 | $145,400 |
| 2020 | $5,174 | $138,800 | $44,000 | $94,800 |
| 2019 | $5,219 | $138,800 | $44,000 | $94,800 |
| 2018 | $5,152 | $138,800 | $44,000 | $94,800 |
| 2017 | $5,166 | $138,800 | $44,000 | $94,800 |
| 2016 | $5,051 | $138,800 | $44,000 | $94,800 |
Source: Public Records
Map
Nearby Homes