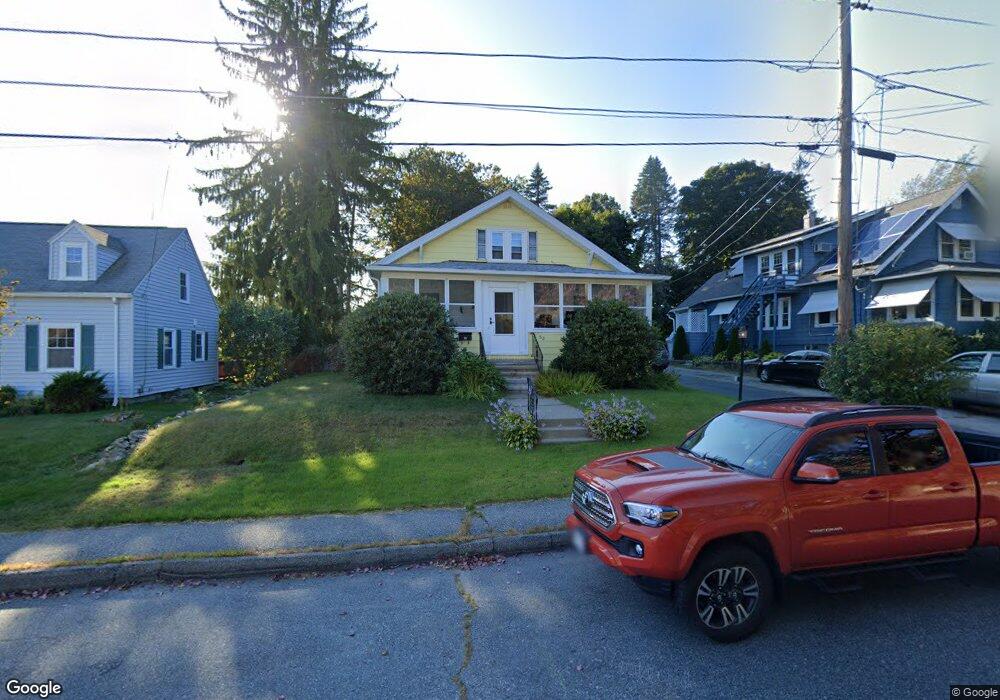
52 Sumner St Auburn, MA 01501
Stoneville NeighborhoodEstimated Value: $408,000 - $483,000
2
Beds
2
Baths
1,725
Sq Ft
$254/Sq Ft
Est. Value
About This Home
This home is located at 52 Sumner St, Auburn, MA 01501 and is currently estimated at $437,340, approximately $253 per square foot. 52 Sumner St is a home located in Worcester County with nearby schools including Auburn Senior High School, Canterbury Street School, and Shrewsbury Montessori School - Auburn Campus.
Ownership History
Date
Name
Owned For
Owner Type
Purchase Details
Closed on
Jun 15, 1994
Sold by
Audette Homer J and Audette Eleanor
Bought by
Ferrie John D and Ferrie Annette L
Current Estimated Value
Home Financials for this Owner
Home Financials are based on the most recent Mortgage that was taken out on this home.
Original Mortgage
$88,395
Interest Rate
8.5%
Mortgage Type
Purchase Money Mortgage
Create a Home Valuation Report for This Property
The Home Valuation Report is an in-depth analysis detailing your home's value as well as a comparison with similar homes in the area
Home Values in the Area
Average Home Value in this Area
Purchase History
| Date | Buyer | Sale Price | Title Company |
|---|---|---|---|
| Ferrie John D | $91,000 | -- |
Source: Public Records
Mortgage History
| Date | Status | Borrower | Loan Amount |
|---|---|---|---|
| Open | Ferrie John D | $7,000 | |
| Closed | Ferrie John D | $88,395 |
Source: Public Records
Tax History
| Year | Tax Paid | Tax Assessment Tax Assessment Total Assessment is a certain percentage of the fair market value that is determined by local assessors to be the total taxable value of land and additions on the property. | Land | Improvement |
|---|---|---|---|---|
| 2025 | $48 | $337,100 | $112,800 | $224,300 |
| 2024 | $4,793 | $321,000 | $106,900 | $214,100 |
| 2023 | $4,754 | $299,400 | $97,100 | $202,300 |
| 2022 | $4,368 | $259,700 | $97,100 | $162,600 |
| 2021 | $4,013 | $221,200 | $85,700 | $135,500 |
| 2020 | $3,952 | $219,800 | $85,700 | $134,100 |
| 2019 | $3,966 | $215,300 | $84,800 | $130,500 |
| 2018 | $3,813 | $206,800 | $79,300 | $127,500 |
| 2017 | $3,602 | $196,400 | $71,900 | $124,500 |
| 2016 | $3,513 | $194,200 | $75,100 | $119,100 |
| 2015 | $3,310 | $191,800 | $75,100 | $116,700 |
| 2014 | $3,242 | $187,500 | $71,500 | $116,000 |
Source: Public Records
Map
Nearby Homes
- 5 Commonwealth Ave
- 99 Clover St
- 177 Boyce St
- 25 Vinal St Unit 28
- 25 Vinal St Unit 26
- 25 Vinal St Unit 29
- 25 Vinal St Unit 30
- 1 Rockland Road Ct
- 177 Oxford St N
- 204-212 Hampton St
- 11 Hulbert Rd Unit 13
- 31-33 Walsh Ave
- 33 Walsh Ave
- 31 Walsh Ave
- 1034 Southbridge St
- 27 Havana Rd
- 19-20 Williams St
- 154 Pakachoag St
- 40 Bryn Mawr Ave
- 103 Henshaw St
Your Personal Tour Guide
Ask me questions while you tour the home.