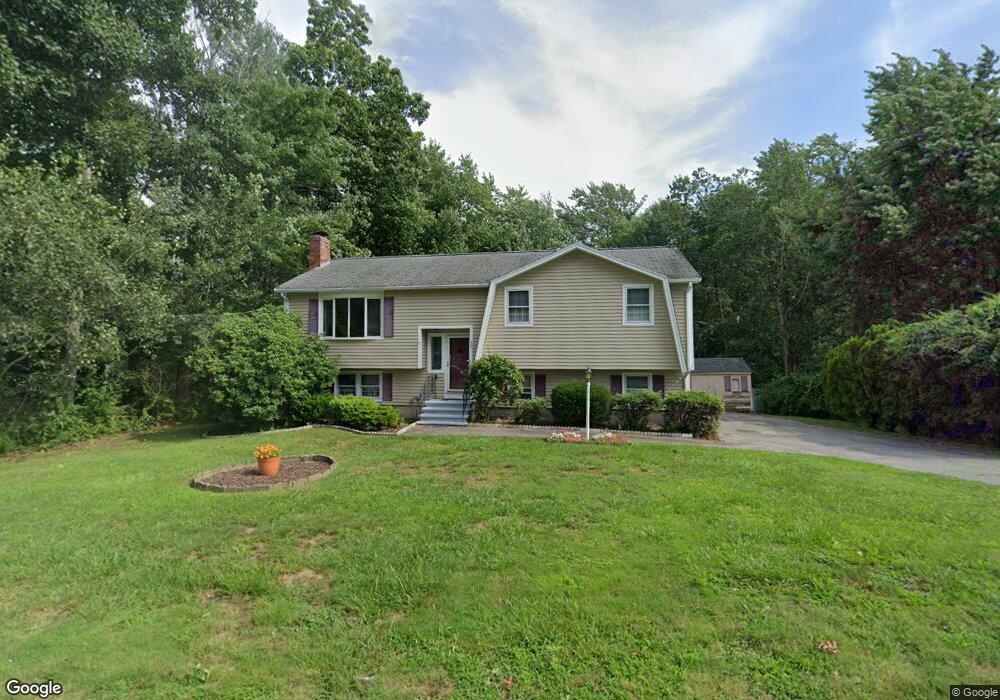
52 Sycamore Rd Methuen, MA 01844
The East End NeighborhoodEstimated Value: $655,333 - $707,000
4
Beds
2
Baths
2,134
Sq Ft
$320/Sq Ft
Est. Value
About This Home
This home is located at 52 Sycamore Rd, Methuen, MA 01844 and is currently estimated at $683,833, approximately $320 per square foot. 52 Sycamore Rd is a home located in Essex County with nearby schools including Timony Grammar School, Methuen High School, and Saint Monica School.
Ownership History
Date
Name
Owned For
Owner Type
Purchase Details
Closed on
Jun 11, 2004
Sold by
Fronduto Michael
Bought by
Mcgrane John F and Mcgrane Arlene M
Current Estimated Value
Home Financials for this Owner
Home Financials are based on the most recent Mortgage that was taken out on this home.
Original Mortgage
$314,900
Outstanding Balance
$151,590
Interest Rate
5.99%
Mortgage Type
Purchase Money Mortgage
Estimated Equity
$532,243
Purchase Details
Closed on
Apr 28, 2003
Sold by
Yelle Louis E and Yelle Roland J
Bought by
Fronduto Michael
Home Financials for this Owner
Home Financials are based on the most recent Mortgage that was taken out on this home.
Original Mortgage
$234,000
Interest Rate
5.64%
Mortgage Type
Purchase Money Mortgage
Create a Home Valuation Report for This Property
The Home Valuation Report is an in-depth analysis detailing your home's value as well as a comparison with similar homes in the area
Home Values in the Area
Average Home Value in this Area
Purchase History
| Date | Buyer | Sale Price | Title Company |
|---|---|---|---|
| Mcgrane John F | $379,900 | -- | |
| Mcgrane John F | $379,900 | -- | |
| Fronduto Michael | $292,500 | -- | |
| Fronduto Michael | $292,500 | -- |
Source: Public Records
Mortgage History
| Date | Status | Borrower | Loan Amount |
|---|---|---|---|
| Open | Mcgrane John F | $314,900 | |
| Closed | Fronduto Michael | $314,900 | |
| Previous Owner | Fronduto Michael | $234,000 |
Source: Public Records
Tax History
| Year | Tax Paid | Tax Assessment Tax Assessment Total Assessment is a certain percentage of the fair market value that is determined by local assessors to be the total taxable value of land and additions on the property. | Land | Improvement |
|---|---|---|---|---|
| 2025 | $5,808 | $549,000 | $237,400 | $311,600 |
| 2024 | $5,880 | $541,400 | $216,600 | $324,800 |
| 2023 | $5,552 | $474,500 | $192,500 | $282,000 |
| 2022 | $5,356 | $410,400 | $160,400 | $250,000 |
| 2021 | $5,097 | $386,400 | $152,400 | $234,000 |
| 2020 | $5,064 | $376,800 | $152,400 | $224,400 |
| 2019 | $4,846 | $341,500 | $136,300 | $205,200 |
| 2018 | $4,683 | $328,200 | $136,300 | $191,900 |
| 2017 | $4,517 | $308,300 | $136,300 | $172,000 |
| 2016 | $4,348 | $293,600 | $128,300 | $165,300 |
| 2015 | $4,238 | $290,300 | $128,300 | $162,000 |
Source: Public Records
Map
Nearby Homes
- 611 Prospect St
- 593 Prospect St
- Lot 108 Garden City Rd
- 173 Jackson St
- 97 Kenwood Rd
- 64-66 Howe St
- 28 Currier Ave
- 123 Lawrence St
- 6 Huse Rd
- 25-27 Bicknell Ave
- 65 Arthur St
- 281 Broadway
- 545 Hampshire St Unit 545
- 8 Ridgeview Ave
- 3 Adams Ave
- 25 Carol Ave
- 9-11 Horne St
- 29 Center St
- 9 Russ St
- 7 Tree Top Way
Your Personal Tour Guide
Ask me questions while you tour the home.