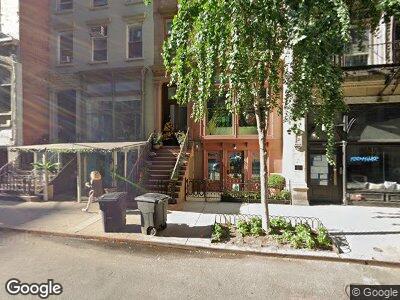
52 W 22nd St Unit 4 New York, NY 10010
Flatiron District NeighborhoodEstimated Value: $1,805,856 - $2,226,000
--
Bed
--
Bath
1,048
Sq Ft
$1,925/Sq Ft
Est. Value
About This Home
This home is located at 52 W 22nd St Unit 4, New York, NY 10010 and is currently estimated at $2,017,214, approximately $1,924 per square foot. 52 W 22nd St Unit 4 is a home located in New York County with nearby schools including P.S. 11 Sarah J. Garnet School, Clinton School, and Middle School 297.
Ownership History
Date
Name
Owned For
Owner Type
Purchase Details
Closed on
Sep 13, 2012
Sold by
Cornell Christopher and Pentland Christine
Bought by
Oppold Jennifer Ralph and Oppold Paul
Current Estimated Value
Home Financials for this Owner
Home Financials are based on the most recent Mortgage that was taken out on this home.
Original Mortgage
$647,975
Outstanding Balance
$460,476
Interest Rate
3.62%
Mortgage Type
Purchase Money Mortgage
Estimated Equity
$1,487,505
Purchase Details
Closed on
Jun 2, 2008
Sold by
M A H G Realty Llc
Bought by
Cornell Christopher and Pentland Christine
Home Financials for this Owner
Home Financials are based on the most recent Mortgage that was taken out on this home.
Original Mortgage
$729,000
Interest Rate
6.13%
Mortgage Type
Purchase Money Mortgage
Create a Home Valuation Report for This Property
The Home Valuation Report is an in-depth analysis detailing your home's value as well as a comparison with similar homes in the area
Home Values in the Area
Average Home Value in this Area
Purchase History
| Date | Buyer | Sale Price | Title Company |
|---|---|---|---|
| Oppold Jennifer Ralph | $1,300,000 | -- | |
| Oppold Jennifer Ralph | $1,300,000 | -- | |
| Cornell Christopher | $1,395,000 | -- | |
| Cornell Christopher | $1,395,000 | -- |
Source: Public Records
Mortgage History
| Date | Status | Borrower | Loan Amount |
|---|---|---|---|
| Open | Oppold Jennifer Ralph | $647,975 | |
| Closed | Oppold Jennifer Ralph | $647,975 | |
| Previous Owner | Cornell Christopher | $729,000 |
Source: Public Records
Tax History Compared to Growth
Tax History
| Year | Tax Paid | Tax Assessment Tax Assessment Total Assessment is a certain percentage of the fair market value that is determined by local assessors to be the total taxable value of land and additions on the property. | Land | Improvement |
|---|---|---|---|---|
| 2024 | $20,260 | $162,058 | $46,512 | $141,122 |
| 2023 | $15,186 | $150,054 | $23,262 | $126,792 |
| 2022 | $15,146 | $325,060 | $46,512 | $278,548 |
| 2021 | $17,837 | $305,158 | $46,512 | $258,646 |
| 2020 | $13,854 | $327,397 | $46,512 | $280,885 |
| 2019 | $12,971 | $323,251 | $46,512 | $276,739 |
| 2018 | $19,204 | $150,985 | $20,269 | $130,716 |
| 2017 | $19,204 | $150,985 | $22,928 | $128,057 |
| 2016 | $18,862 | $146,305 | $24,503 | $121,802 |
| 2015 | $9,653 | $135,468 | $24,018 | $111,450 |
| 2014 | $9,653 | $125,434 | $18,528 | $106,906 |
Source: Public Records
Map
Nearby Homes
- 40 W 22nd St Unit 4
- 29 W 21st St Unit 5
- 29 W 21st St Unit 2
- 29 W 21st St Unit 4
- 34 W 21st St
- 31 W 21st St Unit 5
- 655 6th Ave Unit 5 H
- 655 6th Ave Unit 5K
- 655 6th Ave Unit 2 H
- 655 6th Ave Unit 2E
- 21 W 20th St Unit 1
- 21 W 20th St Unit 5
- 116 W 22nd St Unit 3
- 133 W 22nd St Unit 5J
- 133 W 22nd St Unit 3J
- 133 W 22nd St Unit 8H
- 35 W 23rd St Unit 2
- 40 W 24th St Unit 6WEST
- 40 W 24th St Unit 3E
- 650 6th Ave Unit 2F
- 52 W 22nd St Unit 5
- 52 W 22nd St Unit 4
- 52 W 22nd St Unit 3
- 52 W 22nd St Unit 2
- 52 W 22nd St Unit 1
- 52 W 22nd St
- 52 W 22nd St Unit PH
- 50 W 22nd St
- 50 W 22nd St Unit 1
- 54 W 22nd St
- 48 W 22nd St
- 48 W 22nd St Unit 3
- 48 W 22nd St Unit 5
- 48 W 22nd St Unit 4
- 48 W 22nd St Unit 1
- 48 W 22nd St Unit 2
- 48 W 22nd St Unit 6
- 48 W 22nd St Unit RETAIL
- 56-58 W 22nd St
- 46 W 22nd St