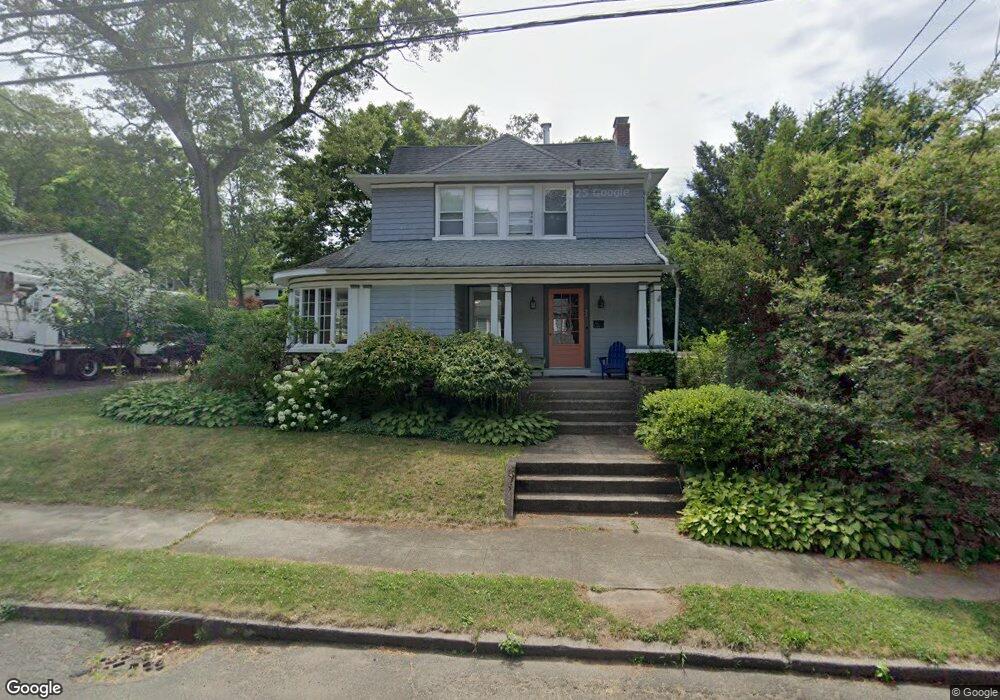
52 Wilkins St Hamden, CT 06517
Estimated Value: $364,000 - $465,000
3
Beds
2
Baths
1,614
Sq Ft
$254/Sq Ft
Est. Value
About This Home
This home is located at 52 Wilkins St, Hamden, CT 06517 and is currently estimated at $409,287, approximately $253 per square foot. 52 Wilkins St is a home located in New Haven County with nearby schools including Ridge Hill School, Hamden Middle School, and Hamden High School.
Ownership History
Date
Name
Owned For
Owner Type
Purchase Details
Closed on
Feb 27, 2006
Sold by
Cahill Maria A
Bought by
Collinane Rachel A
Current Estimated Value
Home Financials for this Owner
Home Financials are based on the most recent Mortgage that was taken out on this home.
Original Mortgage
$210,000
Interest Rate
6.17%
Purchase Details
Closed on
Jun 25, 2003
Sold by
Harkness Peter J and Harkness Sara
Bought by
Cullinane Rachel A and Cahill Maria A
Purchase Details
Closed on
Jun 23, 2000
Sold by
Schultz Robert T and Schultz Kathryn A
Bought by
Hackness Peter J and Hackness Sara
Purchase Details
Closed on
Aug 9, 1996
Sold by
Wollaeger Mark A and Wilhelms Lon
Bought by
Schultz Kathryn A and Schultz Robert T
Purchase Details
Closed on
Sep 25, 1989
Sold by
Champlin Kenneth M
Bought by
Wollaeger Mark A
Create a Home Valuation Report for This Property
The Home Valuation Report is an in-depth analysis detailing your home's value as well as a comparison with similar homes in the area
Home Values in the Area
Average Home Value in this Area
Purchase History
| Date | Buyer | Sale Price | Title Company |
|---|---|---|---|
| Collinane Rachel A | $45,000 | -- | |
| Cullinane Rachel A | $241,000 | -- | |
| Hackness Peter J | $170,000 | -- | |
| Schultz Kathryn A | $143,500 | -- | |
| Wollaeger Mark A | $210,000 | -- |
Source: Public Records
Mortgage History
| Date | Status | Borrower | Loan Amount |
|---|---|---|---|
| Open | Wollaeger Mark A | $203,500 | |
| Closed | Wollaeger Mark A | $215,100 | |
| Closed | Wollaeger Mark A | $210,000 |
Source: Public Records
Tax History
| Year | Tax Paid | Tax Assessment Tax Assessment Total Assessment is a certain percentage of the fair market value that is determined by local assessors to be the total taxable value of land and additions on the property. | Land | Improvement |
|---|---|---|---|---|
| 2025 | $11,897 | $229,320 | $65,450 | $163,870 |
| 2024 | $8,770 | $157,710 | $44,870 | $112,840 |
| 2023 | $8,892 | $157,710 | $44,870 | $112,840 |
| 2022 | $8,750 | $157,710 | $44,870 | $112,840 |
| 2021 | $8,270 | $157,710 | $44,870 | $112,840 |
| 2020 | $7,514 | $144,550 | $53,480 | $91,070 |
| 2019 | $7,063 | $144,550 | $53,480 | $91,070 |
| 2018 | $6,933 | $144,550 | $53,480 | $91,070 |
| 2017 | $6,542 | $144,550 | $53,480 | $91,070 |
| 2016 | $6,557 | $144,550 | $53,480 | $91,070 |
| 2015 | $6,963 | $170,380 | $77,210 | $93,170 |
| 2014 | $6,803 | $170,380 | $77,210 | $93,170 |
Source: Public Records
Map
Nearby Homes
- 159 Augur St
- 133 Blake Rd
- 36 Rolfe St
- 1150 Whitney Ave Unit 5
- 131 Bryden Terrace
- 1204 Whitney Ave Unit 118
- 1165 Whitney Ave
- 634 Newhall St
- 171 Morse St
- 1002 Winchester Ave
- 144 Edgehill Rd
- 210 Treadwell St Unit 310
- 210 Treadwell St Unit 405
- 126 Hartford Turnpike
- 26 Lander St
- 2022 Whitney Ave
- 1412 Whitney Ave Unit J1
- 1414 Whitney Ave Unit E3
- 290 Treadwell St Unit 1402
- 32 Dawes Ave
Your Personal Tour Guide
Ask me questions while you tour the home.