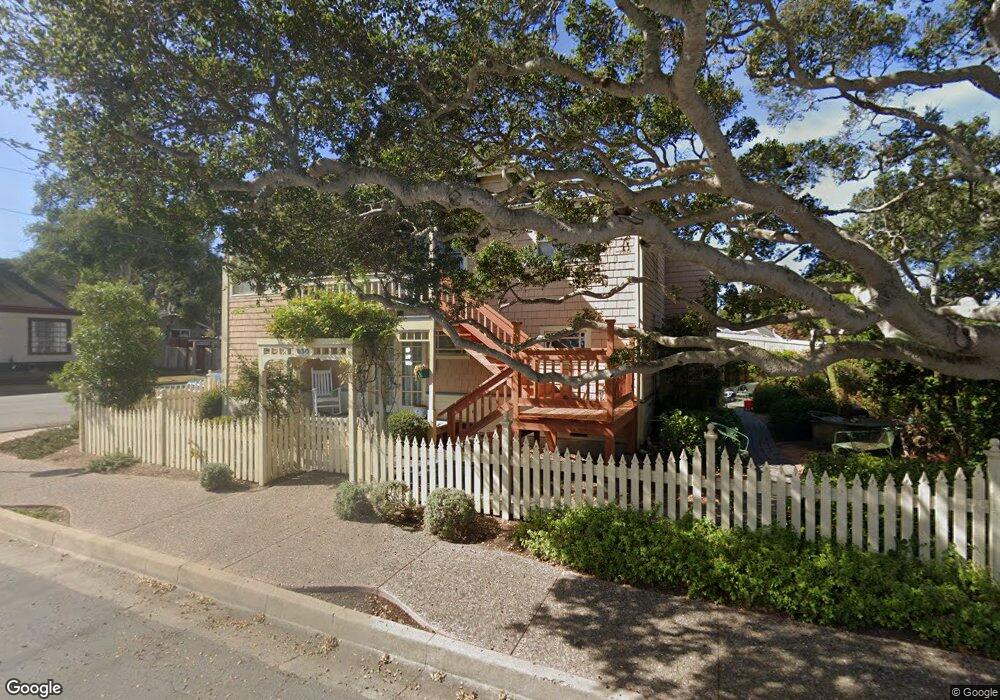
520 Lobos Ave Pacific Grove, CA 93950
Estimated Value: $1,361,000 - $1,795,000
2
Beds
3
Baths
1,608
Sq Ft
$949/Sq Ft
Est. Value
About This Home
This home is located at 520 Lobos Ave, Pacific Grove, CA 93950 and is currently estimated at $1,525,386, approximately $948 per square foot. 520 Lobos Ave is a home located in Monterey County with nearby schools including Robert Down Elementary School, Pacific Grove Middle School, and Pacific Grove High School.
Ownership History
Date
Name
Owned For
Owner Type
Purchase Details
Closed on
Aug 8, 2000
Sold by
Bell Laurence D and Bell Linda J
Bought by
Leslie Richard B and Leslie Kathleen L
Current Estimated Value
Home Financials for this Owner
Home Financials are based on the most recent Mortgage that was taken out on this home.
Original Mortgage
$225,000
Outstanding Balance
$81,410
Interest Rate
8.19%
Estimated Equity
$1,443,976
Purchase Details
Closed on
Aug 4, 1998
Sold by
Osland Erin
Bought by
Bell Laurence D and Bell Linda J
Home Financials for this Owner
Home Financials are based on the most recent Mortgage that was taken out on this home.
Original Mortgage
$200,000
Interest Rate
6.93%
Purchase Details
Closed on
Jan 31, 1996
Sold by
Mcfarland Rex Michael
Bought by
Osland Erin
Home Financials for this Owner
Home Financials are based on the most recent Mortgage that was taken out on this home.
Original Mortgage
$80,000
Interest Rate
7.25%
Purchase Details
Closed on
Jan 30, 1996
Sold by
Osland David
Bought by
Osland Erin
Home Financials for this Owner
Home Financials are based on the most recent Mortgage that was taken out on this home.
Original Mortgage
$80,000
Interest Rate
7.25%
Purchase Details
Closed on
May 4, 1995
Sold by
Johnson Kristi A
Bought by
Mcfarland Rex Michael
Create a Home Valuation Report for This Property
The Home Valuation Report is an in-depth analysis detailing your home's value as well as a comparison with similar homes in the area
Home Values in the Area
Average Home Value in this Area
Purchase History
| Date | Buyer | Sale Price | Title Company |
|---|---|---|---|
| Leslie Richard B | $593,000 | Stewart Title | |
| Bell Laurence D | $378,000 | Chicago Title Co | |
| Osland Erin | $280,000 | Stewart Title | |
| Osland Erin | -- | Stewart Title | |
| Mcfarland Rex Michael | -- | Stewart Title |
Source: Public Records
Mortgage History
| Date | Status | Borrower | Loan Amount |
|---|---|---|---|
| Open | Leslie Richard B | $225,000 | |
| Previous Owner | Bell Laurence D | $200,000 | |
| Previous Owner | Osland Erin | $80,000 |
Source: Public Records
Tax History
| Year | Tax Paid | Tax Assessment Tax Assessment Total Assessment is a certain percentage of the fair market value that is determined by local assessors to be the total taxable value of land and additions on the property. | Land | Improvement |
|---|---|---|---|---|
| 2025 | $9,353 | $893,088 | $602,731 | $290,357 |
| 2024 | $9,353 | $875,577 | $590,913 | $284,664 |
| 2023 | $9,482 | $858,410 | $579,327 | $279,083 |
| 2022 | $9,290 | $841,579 | $567,968 | $273,611 |
| 2021 | $9,243 | $825,079 | $556,832 | $268,247 |
| 2020 | $9,058 | $816,620 | $551,123 | $265,497 |
| 2019 | $8,770 | $800,609 | $540,317 | $260,292 |
| 2018 | $8,596 | $784,912 | $529,723 | $255,189 |
| 2017 | $8,456 | $769,523 | $519,337 | $250,186 |
| 2016 | $8,477 | $754,435 | $509,154 | $245,281 |
| 2015 | $8,340 | $743,104 | $501,507 | $241,597 |
| 2014 | $8,088 | $728,549 | $491,684 | $236,865 |
Source: Public Records
Map
Nearby Homes
- 791 Spruce Ave
- 745 Sinex Ave
- 311 Lobos Ave
- 805 Sinex Ave
- 302 Park St
- 851 Laurel Ave
- 618 Forest Ave
- 226 Willow St
- 206 Cypress Ave Unit B
- 224 16th St
- 712 Sunset Dr
- 860 Sunset Dr
- 515 13th St
- 520 Lighthouse Ave Unit 301
- 157 15th St
- 127 16th St
- 132 Forest Ave
- 410 Pine Ave
- 160 Monterey Ave
- 700 Briggs Ave Unit 77
Your Personal Tour Guide
Ask me questions while you tour the home.