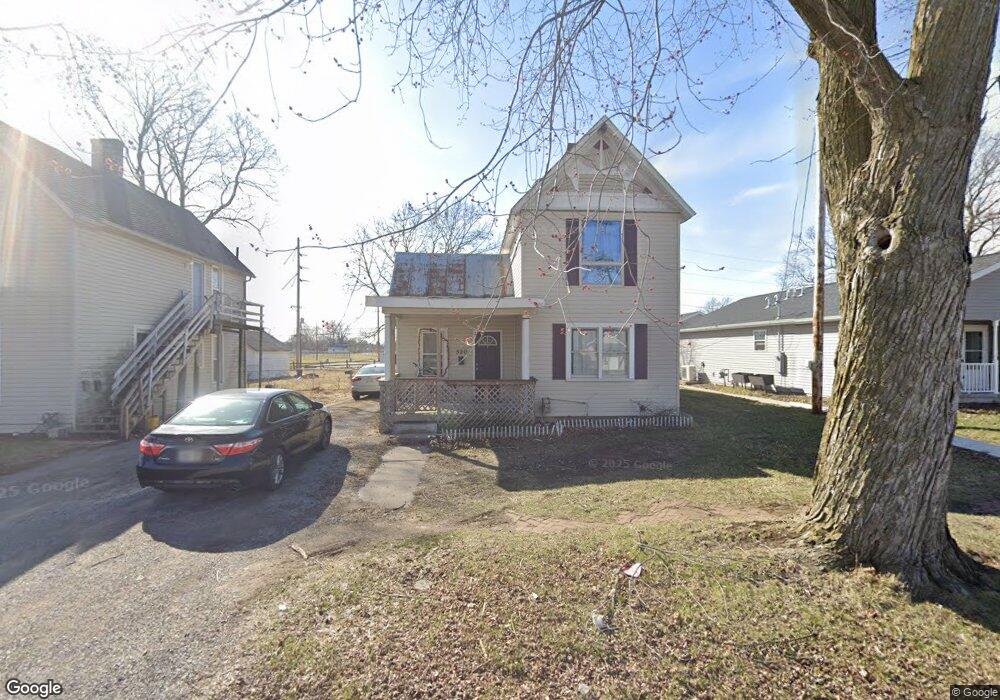
520 N Cory St Findlay, OH 45840
Estimated Value: $128,000 - $152,000
3
Beds
1
Bath
1,345
Sq Ft
$104/Sq Ft
Est. Value
About This Home
This home is located at 520 N Cory St, Findlay, OH 45840 and is currently estimated at $139,347, approximately $103 per square foot. 520 N Cory St is a home located in Hancock County with nearby schools including Whittier Primary School, Bigelow Hill Elementary School, and Glenwood Middle School.
Ownership History
Date
Name
Owned For
Owner Type
Purchase Details
Closed on
Nov 16, 2023
Sold by
Habitat For Humanity Of Findlay/Hancock
Bought by
Lowry Brittney
Current Estimated Value
Purchase Details
Closed on
Feb 26, 2015
Sold by
Home Opportunity Llc
Bought by
Rosi Enterprises Llc
Purchase Details
Closed on
Apr 9, 2013
Sold by
Transportation Alliance Bank Inc
Bought by
Home Opportunity Llc
Purchase Details
Closed on
Jun 28, 2012
Sold by
Home Solutions Partners Iv Reo Llc
Bought by
Transportation Alliance Bank Inc
Purchase Details
Closed on
Jul 20, 2010
Sold by
Stewardship Fund Lp
Bought by
Home Solutions Partners Iv Reo Llc
Purchase Details
Closed on
Jun 5, 2009
Sold by
Taylor Eileen
Bought by
Stewardship Fund Lp
Purchase Details
Closed on
Nov 23, 2004
Sold by
Taylor Eileen
Bought by
Taylor Eileen
Home Financials for this Owner
Home Financials are based on the most recent Mortgage that was taken out on this home.
Original Mortgage
$99,261
Interest Rate
5.89%
Mortgage Type
New Conventional
Purchase Details
Closed on
Mar 11, 1987
Bought by
Salaz Eileen
Create a Home Valuation Report for This Property
The Home Valuation Report is an in-depth analysis detailing your home's value as well as a comparison with similar homes in the area
Home Values in the Area
Average Home Value in this Area
Purchase History
| Date | Buyer | Sale Price | Title Company |
|---|---|---|---|
| Lowry Brittney | $166,000 | Golden Key Title | |
| Rosi Enterprises Llc | $22,000 | Omega Title Agency Llc | |
| Home Opportunity Llc | -- | None Available | |
| Transportation Alliance Bank Inc | $20,922 | Attorney | |
| Home Solutions Partners Iv Reo Llc | $12,700 | None Available | |
| Stewardship Fund Lp | $99,261 | None Available | |
| Taylor Eileen | -- | -- | |
| Salaz Eileen | -- | -- |
Source: Public Records
Mortgage History
| Date | Status | Borrower | Loan Amount |
|---|---|---|---|
| Previous Owner | Taylor Eileen | $99,261 |
Source: Public Records
Tax History Compared to Growth
Tax History
| Year | Tax Paid | Tax Assessment Tax Assessment Total Assessment is a certain percentage of the fair market value that is determined by local assessors to be the total taxable value of land and additions on the property. | Land | Improvement |
|---|---|---|---|---|
| 2024 | $1,391 | $38,170 | $5,220 | $32,950 |
| 2023 | $1,394 | $38,170 | $5,220 | $32,950 |
| 2022 | $1,389 | $38,170 | $5,220 | $32,950 |
| 2021 | $1,172 | $28,050 | $5,210 | $22,840 |
| 2020 | $1,172 | $28,050 | $5,210 | $22,840 |
| 2019 | $1,148 | $28,050 | $5,210 | $22,840 |
| 2018 | $1,088 | $24,390 | $4,530 | $19,860 |
| 2017 | $544 | $24,390 | $4,530 | $19,860 |
| 2016 | $1,084 | $24,390 | $4,530 | $19,860 |
| 2015 | $1,154 | $25,650 | $4,530 | $21,120 |
| 2014 | $1,253 | $25,650 | $4,530 | $21,120 |
| 2012 | $1,043 | $23,010 | $4,530 | $18,480 |
Source: Public Records
Map
Nearby Homes
- 224 Defiance Ave
- 512 N Cory St
- 706 N Cory St
- 207 Ash Ave
- 0 Canadian Way Unit 20253551
- 0 Canadian Way Unit 6135400
- 213 Cherry St
- 524 Defiance Ave
- 115 George St
- 247 Crystal Ave
- 407 Washington St
- 206 Midland Ave
- 533 Davis St
- 230 Midland Ave
- 210 Western Ave
- 604 Davis St
- 523 Center St
- 1005 Broad Ave
- 545 Clinton Ct
- 420 Allen Ave
- 518 N Cory St
- 524 N Cory St
- 528 N Cory St
- 510 N Cory St
- 133 Defiance Ave
- 133 Defiance Ave Unit Front
- 508 N Cory St
- 133 Defiance Ave Front
- 519 N Cory St
- 506 N Cory St
- 127 Defiance Ave
- 200 Defiance Ave
- 204 Defiance Ave
- 221 Defiance Ave
- 500 N Cory St
- 515 N Cory St
- 125 Defiance Ave
- 223 Defiance Ave
- 606 N Cory St
- 509 N Cory St