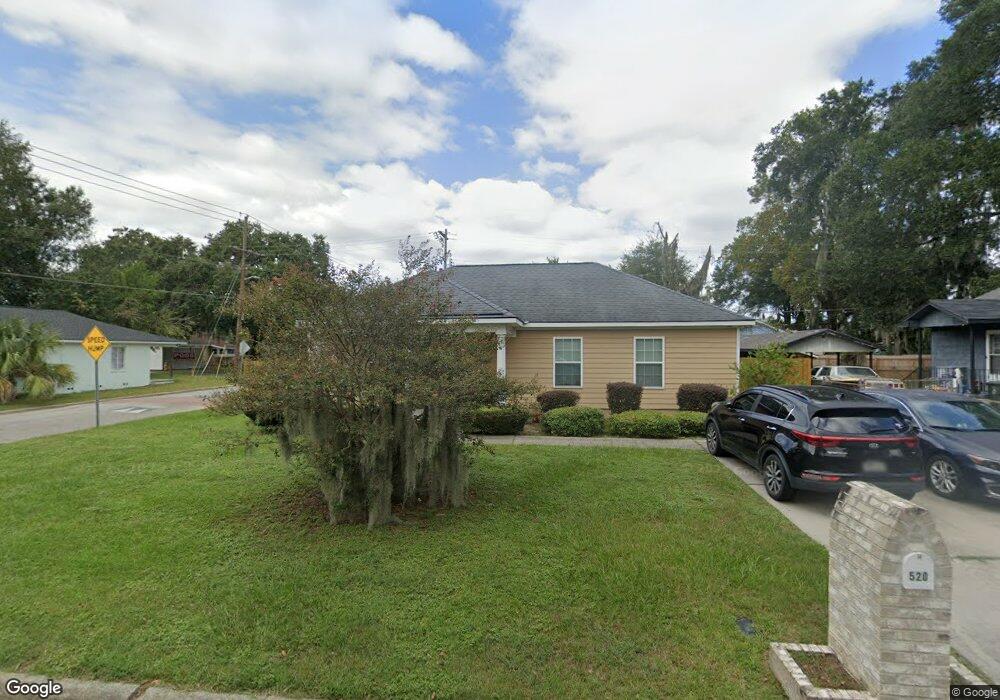
520 W 60th St Savannah, GA 31405
Feiler Park NeighborhoodEstimated Value: $195,000 - $440,000
3
Beds
2
Baths
1,144
Sq Ft
$241/Sq Ft
Est. Value
About This Home
This home is located at 520 W 60th St, Savannah, GA 31405 and is currently estimated at $275,242, approximately $240 per square foot. 520 W 60th St is a home with nearby schools including Haven Elementary School, Myers Middle School, and Beach High School.
Ownership History
Date
Name
Owned For
Owner Type
Purchase Details
Closed on
May 14, 2013
Sold by
Chatham County
Bought by
Coastal Empire Habitat For Hum
Current Estimated Value
Purchase Details
Closed on
Oct 6, 2009
Sold by
Chatham County Gegoria
Bought by
Chatham County
Create a Home Valuation Report for This Property
The Home Valuation Report is an in-depth analysis detailing your home's value as well as a comparison with similar homes in the area
Home Values in the Area
Average Home Value in this Area
Purchase History
| Date | Buyer | Sale Price | Title Company |
|---|---|---|---|
| Coastal Empire Habitat For Hum | $4,100 | -- | |
| Chatham County | $3,500 | -- |
Source: Public Records
Tax History Compared to Growth
Tax History
| Year | Tax Paid | Tax Assessment Tax Assessment Total Assessment is a certain percentage of the fair market value that is determined by local assessors to be the total taxable value of land and additions on the property. | Land | Improvement |
|---|---|---|---|---|
| 2025 | $778 | $96,240 | $16,000 | $80,240 |
| 2024 | $778 | $85,080 | $16,000 | $69,080 |
| 2023 | $343 | $77,200 | $8,000 | $69,200 |
| 2022 | $381 | $31,200 | $3,400 | $27,800 |
| 2021 | $1,000 | $27,800 | $3,400 | $24,400 |
| 2020 | $675 | $27,800 | $3,400 | $24,400 |
| 2019 | $1,032 | $27,800 | $3,400 | $24,400 |
| 2018 | $657 | $26,840 | $3,400 | $23,440 |
| 2017 | $606 | $27,120 | $3,520 | $23,600 |
| 2016 | $591 | $26,560 | $3,520 | $23,040 |
| 2015 | $935 | $26,840 | $3,520 | $23,320 |
| 2014 | $918 | $26,840 | $0 | $0 |
Source: Public Records
Map
Nearby Homes